
Heikin Ashi Trading Strategy

The Heikin Ashi chart is another way traders can read the market and find trade setups. It stands out for how clean it looks, without the noise you often see on standard Japanese candlesticks. In this article we walk through a simple Heikin Ashi trading strategy, broken into five easy steps.
What you need for the Heikin Ashi strategy
All you need for the Heikin Ashi strategy is to add the Heikin Ashi chart to your trading platform. The good part is that you do not have to download a Heikin Ashi indicator, since it is built into almost every trading platform, including MetaTrader.
Time frame used
The Heikin Ashi strategy works on time frames from one minute up to one week, so you can combine it with most types of trading strategies.
Rules of the Heikin Ashi strategy
We will split the trading strategy into five steps to keep it easy to apply.
1- Step one: find the overall price trend, then wait for a pullback
The first rule in the Heikin Ashi strategy is to identify the market’s overall direction and wait for a pullback, because trading in line with the broader trend tends to work in your favour. Look at the chart below.
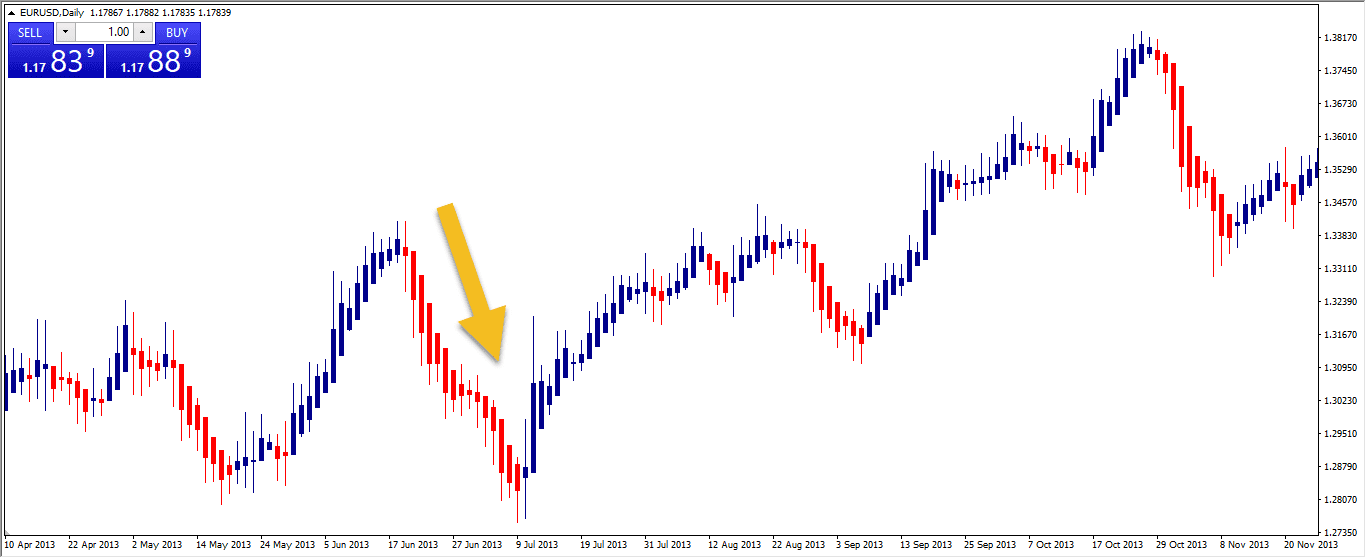
What we do is wait for the pullback to finish, then enter a buy trade.
2- Step two: wait for a double-shadow candle
A double-shadow candle is a reversal candle that points to a change in direction. It has two shadows, one on top and one on the bottom, as shown below.
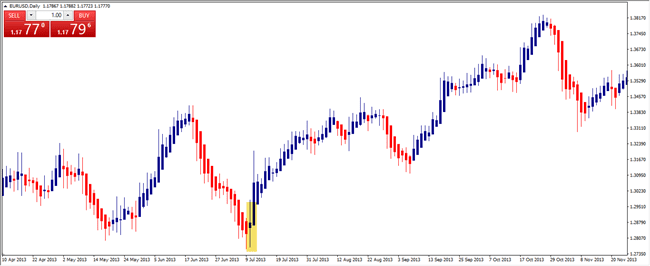
In the chart above, notice that the pullback has ended and the trend resumed after a double-shadow candle appeared, with the colour changing from falling red to rising blue.

3- Step three: enter a buy trade at the open of the candle that follows the double-shadow candle
Do not rush and jump into a trade the moment the candle colour changes. Be patient and disciplined, and wait for a new candle to open.
Step four: set your stop-loss at the lowest point of the double-shadow candle
The best place for your stop-loss is at the lowest point the price reached, which sits below the double-shadow candle, as shown in the chart.
Step five: set your take-profit
Some traders use a fixed take-profit equal to twice the stop-loss, which is fine, but you may leave a lot of profit on the table. It is often better to keep the trade open and only exit when there is a reason to, such as the candles changing colour or a double-shadow candle appearing. Look at the chart below.
In the chart above we exited the trade after the candles changed colour to red (turning to the downside).
Note: the steps above apply to buy trades. You can use the same rules in the opposite direction for sell trades.
Read also: Best Bitcoin trading strategy in 5 steps.
Key takeaways
- The Heikin Ashi technique is another form of chart traders can use to read the market and spot trade setups, with a clean look that removes much of the noise found on standard Japanese candlesticks.
- A double-shadow candle is a reversal candle that signals a possible change in direction.
- Heikin Ashi is one of the most accessible indicators. It needs no installation and can be found on almost any trading platform.
- It is easy to read on the chart. Any trader can interpret Heikin Ashi patterns, and its candles are often easier to read than traditional candlestick charts, which makes market direction and moves simpler to identify.
- Heikin Ashi is built from historical price data and is used to smooth the picture of the trend.
- Heikin Ashi filters out market noise and reduces small pullbacks, which can make signals clearer and help you gauge direction.
- The Heikin Ashi indicator can be combined with other technical indicators to give stronger read on market movement.
- Heikin Ashi can be used on any time frame, from hourly to daily to monthly, though larger time frames tend to be more reliable.
Try this strategy on a demo account first
A strategy that looks clear in an article can behave very differently under real spreads and volatility. Testing it on a demo account shows you how it performs before you commit any capital.
Advertising disclosure: partner link. Easy Trade may receive compensation. Educational content, not financial advice. CFDs carry a high risk of losing your capital.