
Market Profile Forex Commodities

In 1984, Peter Steidlmayer introduced a distinctive trading approach he called Market Profile. It is used to read likely market movement based on the prior session, and it rests on three core elements: volume, time, and price. Market Profile gives a full technical picture of price over a chosen period. This article explains what Market Profile is and how you can trade with it.
What Is Market Profile?
Market Profile is a trading method first presented by Peter Steidlmayer, who worked at the Chicago Board of Trade (CBOT). He wrote a book about it titled “Trading with Market Profile”.
In the simplest terms, Market Profile does three main things every trader needs:
- It reveals the fair market value of any market or asset.
- It shows the price at which traders are most active.
- It shows the price at which trading is weakest.
Knowing this is useful. If you know an asset’s fair value, you can see at once whether a currency or commodity is trading above or below it. At that point you can enter with more confidence: if price has moved above fair value, the expectation is that it tends to move back toward that value, though this is not guaranteed and any signal can fail. This can make it easier to judge likely price direction and to enter with lower risk.
Put another way, it gives you a full picture of market sentiment and a map of where buyers and sellers are most active, though it does not separate the two sides at a price the way a footprint chart does. For a different angle on the same question, the COT report describes how open interest in a related futures contract is distributed across categories of trader.
It works with any market — stocks, forex, indices, bonds, futures, and mutual funds — and in any market condition, up or down. There is only one small difference in the forex market, which we cover below. If the commodity side of that list is new to you, start with our guide to commodity trading.
How Market Profile Works
You use it through the Market Profile helper indicator, which MetaTrader users can download and add. It is also available on TradingView under the name Volume Profile, and on most other trading platforms.
Look at the figure below:
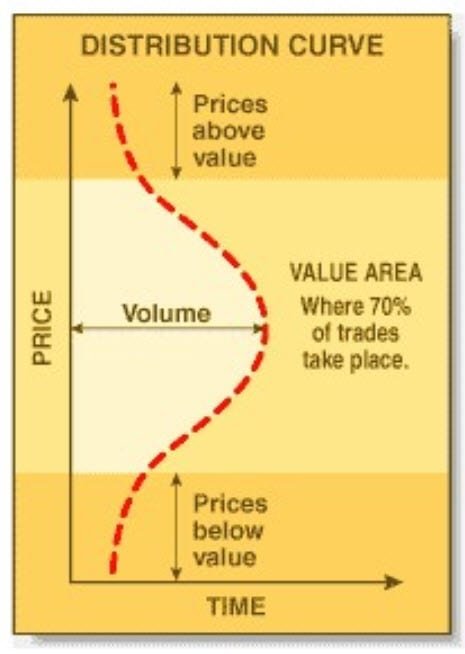
The figure above shows the stages price moves through.
Volume distribution by value:
The middle area is the most active (the “value area” in the chart above), because it holds the large majority of trading volume — about 70% of trades.
Inside the value area sits the “median line”, or “point of control”. This is where traders are more active than anywhere else, and it is the tallest point on the Market Profile indicator. We use it to define the fair value of the currency or commodity being traded.
The upper and lower areas of the price curve show when the market is least active, and they mark the highest and lowest market value for the currency or commodity.
How to Trade With Market Profile
- As noted above, Market Profile lets you know the true value of the currency (the fair price).
- If current price is above the value area, that is a warning sign that price is overextended, and it is not sound to open buy trades. If current price is below the value area, that warns price is very cheap, and it is not sound to open sell trades.
- This is a very simplified read; we go deeper into how to place a trade shortly.
- The idea behind trading with Market Profile treats the market as an auction: when price is too high no one buys, which pushes the currency back toward the fair price; when price is too cheap no one sells, until it returns to the fair price.
- On that basis, the time to open sell trades is when price is overextended, and the time to buy is when price is very cheap.
- Note: what creates the fair price of a currency or commodity is the activity traders show in a specific area of the chart, which we call the value area.
- Let’s look at the chart itself and show how it works.
First, you need the Market Profile indicator. If you use MetaTrader, you can download the indicator here. After downloading and installing it, open it by following the steps as in the image:
If you use TradingView, you’ll find it under the name volume profile; search for it in the indicators list.
After adding the indicator, it appears like this:
As you can see, the indicator has three areas as explained above: the value area in the middle, and the upper and lower areas that show the lowest and highest price, while the point of control marks the fair price.
You can treat the point of control as support or resistance, or as a magnet — price is drawn back to it whenever it moves away. In the figure above, price rose to the upper area until it reached its highest value, then fell to the lower area until it reached its lowest value, and after that began to climb again toward the point of control.
Also look at the figure below:
In the figure above, you’ll notice two points of control on the EUR USD chart. Price was falling at first, and when it reached the first point of control — a support area — it bounced, but soon resumed its downtrend, broke the support, and then retested it. It then fell until it reached the second point of control, a stronger support than the first because the indicator’s value there is higher than at the first point of control; for that reason price bounced fully once it reached it.
Remember that this is the idea trading is built on, not a ready-made strategy.
We’ll study a Market Profile trading strategy below, so don’t worry.
Strategy Types That Suit Market Profile
Market Profile techniques can be used with day-trading strategies and medium-term strategies.
Which Markets Work Best With Market Profile?
The appeal of this technique is that it works with almost any market, any investment instrument, and any timeframe.
Even so, you shouldn’t pick just any instrument; higher liquidity is preferable. In forex, it’s better to trade the major pairs such as EUR USD; in stocks, trade leading names such as Apple and Facebook; and in commodities, trade oil and gold, since these instruments carry large liquidity.

Note: trading stocks with Market Profile may be more precise than trading forex, because in stocks you can measure the trading volume present in the market, whereas forex liquidity is very large and cannot be measured fully. Combining momentum with Market Profile can be a good solution to the volume problem.
A Market Profile Trading Strategy
There are several ways to trade with Market Profile, including combining it with supports and resistances, trend lines, and other classic analysis tools. Here we explain one of the simplest trading strategies, which you can rely on at the start. With time and practice, you’ll be able to combine Market Profile techniques with your own strategy.
Indicators the Strategy Needs
This strategy needs four indicators:
- The Market Profile indicator we’re discussing here.
- The 50-period simple moving average.
- The 20-period simple moving average.
- A volume indicator (you can use the one built into MetaTrader).
The preferred timeframe for this strategy is 30 minutes (30m).
Strategy Rules
Step 1: Mark the point of control on the Market Profile indicator
The point of control is the largest point by volume on the Market Profile indicator, and it represents the market’s fair price as noted above. Look at the figure below:
Step 2: Check the volume indicator — does it match the current move?
The volume indicator shows trading volumes over a given period. If price direction doesn’t match trading volume, a change in the current price move is expected. Look at the figure below:
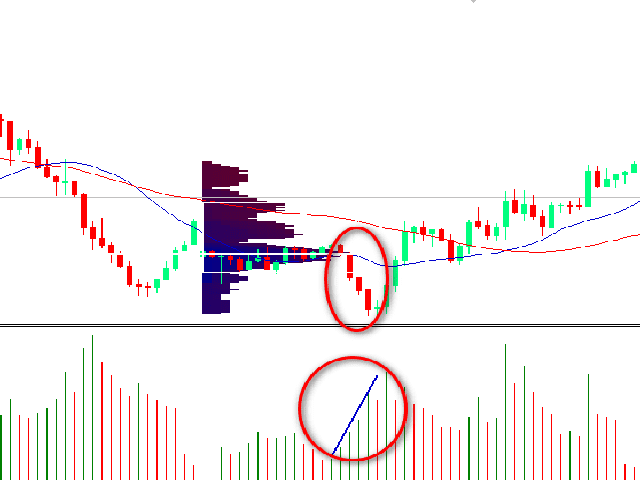
In the figure above, the volume indicator doesn’t support the current move: price is falling, but volume is rising gradually. This is our first sign that the trend may change. It can’t be relied on alone, because the volume indicator doesn’t measure all forex liquidity, unlike other markets such as stocks. So we need another signal before entering a buy trade, which leads to the next rule.
Step 3: Enter a buy after the 50 moving average crosses the 20 moving average
After a divergence appears between price action and the volume indicator, we need one more signal to confirm the trend is in our favor: a crossover between the 50 moving average (red) and the 20 moving average (blue). Look at the figure below:
In the figure above, the 50 moving average (red) crossed the 20 moving average (blue). Now you can enter a buy trade.
Step 4: Set the stop-loss
In this strategy, we place the stop-loss order below the last price point reached, as in the figure below:
Note: we removed the Market Profile indicator only to make the image clearer (don’t do this yourself).
In the figure above, price rose after the crossover. One last thing remains — setting the take-profit order — which leads to the final step.
Step 5: Set the take-profit
Since this strategy is on a small timeframe, we set a fixed take-profit at twice the stop-loss. Look at the figure below:
The above is an example for buy trades only. You can enter a sell trade by applying the same rules in the opposite direction.
Summary
The Market Profile indicator is a classic application of market profiling. It can show price density over time and identify the most important price levels, the value area, and the control value for a given trading session. Market Profile can be attached to timeframes between M1 and D1, and it will display a profile for daily, weekly, monthly, or even intraday sessions.
Market Profile does three main things every trader needs:
- It reveals the fair market value of any market or asset.
- It shows the price at which traders are most active.
- It shows the price at which trading is weakest.
- What creates the fair price of a currency or commodity is the activity traders show in a specific area of the chart, which we call the value area.
- The appeal of this technique is that it works with almost any market, any investment instrument, and any timeframe; even so, you shouldn’t pick just any instrument — higher liquidity is preferable.
- Trading stocks with Market Profile may be more precise than forex, because in stocks you can measure market volume, whereas forex liquidity is very large and can’t be measured fully; combining momentum with Market Profile can be a good solution to the volume problem.
Try this strategy on a demo account first
A strategy that looks clear in an article can behave very differently under real spreads and volatility. Testing it on a demo account shows you how it performs before you commit any capital.
Advertising disclosure: partner link. Easy Trade may receive compensation. Educational content, not financial advice. CFDs carry a high risk of losing your capital.
Disclaimer: This article is for educational purposes only and is not investment advice. Market Profile and the indicators described here show how price and volume are distributed over time; they do not predict future prices, and any signal can fail. Trading forex, commodities, and CFDs carries a high level of risk because of leverage and can lead to the loss of your capital. Do your own research and only trade with money you can afford to lose. Some links on this site may be affiliate links, and we may earn a commission at no extra cost to you.