
Volume Profile Indicator Explained

The Volume Profile indicator refers to an advanced charting study used to show trading activity across specific price levels, also known as volume-by-price. It shows how much volume occurs at particular price levels and ranges, unlike most volume indicators, which display volume based on a set time frame.
On the trading chart, the volume profile appears as horizontal bars on the right, aligned with each price level. When volume and price are combined this way, a trader can identify high-volume price ranges that point to support or resistance. Rather than working it out by hand, compare against computed session levels.
It’s important to note that the volume profile updates every time a new trade order is executed. It also changes as the point of control, the value area, and the high- and low-volume nodes shift multiple times during a given trading session.
As the volume profile develops over the course of a full trading session, new patterns emerge along with new trading opportunities.
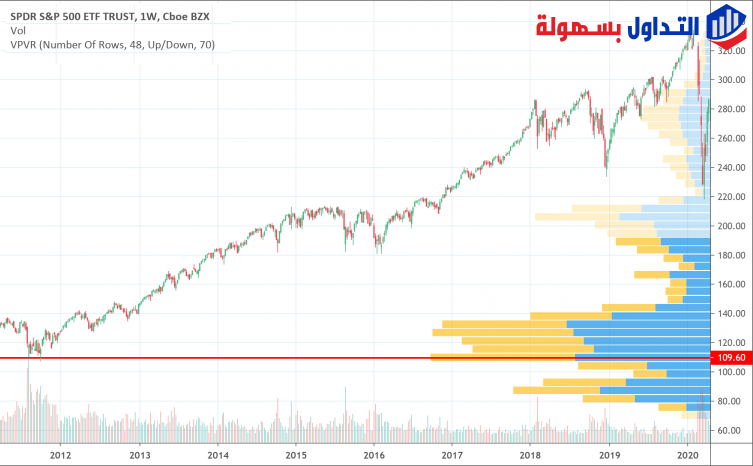
More: Market Profile explained in currency and commodity markets
When to Trade Using the Volume Profile Indicator
Support and Resistance Levels
Experienced traders use the Volume Profile indicator to identify key support and resistance levels. As an interactive method, it draws on past price action and volume behavior, which is why it’s useful for giving meaning to price levels, particularly in a market that has already been traded before.
In trading, a support level is where price tends to find a floor as it moves down, while a resistance level provides pushback as price rises.
Overall, a price level near the bottom of the profile tends to favor buying and is a good indicator of a support level, while a price level near the top of the profile tends to favor selling and, in this case, is a good indicator of a resistance level.
Cyclical Volume Nodes
When trading with the Volume Profile indicator, developing high-volume nodes typically show significant trading activity during the day, reflecting the most common prices for that particular trading session. Low-volume nodes, on the other hand, help show prices that don’t attract much interest.
It’s important to note that high-volume nodes usually experience strong pull, which is why traders tend to gravitate toward these areas. This happens whether prices are rising or falling.

Low-volume nodes attract less pull, which leads to market bounces. As a result, low-volume nodes don’t tend to persist for long, since they experience weaker pull.
A profile counts all of the volume at a level together, while footprint charts split the same volume by side, which requires a data feed carrying the side each trade arrived on.
Because of the cyclical nature of volume nodes, trading opportunities emerge. For example, high-volume nodes help pinpoint where smart money is trading. In other words, high-volume nodes tend to mark exit points, while low-volume nodes tend to offer good entry points.
Read also: Volume indicator calculation for Japanese candlesticks
Final Thoughts on the Volume Profile Indicator
The Volume Profile indicator helps traders see entry and exit points while trading. It also shows the volume traded during a specific trading session.
As a result, it’s considered a valuable technical analysis tool that traders can use. Traders can incorporate it into their trading strategies as part of a broader approach to reading price and volume, though as with any technical tool, it does not guarantee results.
So, at its most basic level, the Volume Profile indicator can provide valuable information: an increase in volume on a breakout above resistance or below support may signal either trend continuation or a reversal.
It may also point to buying on a given day, and a stock may see high volume, which can suggest interest in that stock. But volume alone doesn’t indicate the specific price or prices that traders were most interested in.
Unlike a typical volume study, which aggregates volume over a set time period and shows a single vertical bar for the total volume in that period, the Volume Profile indicator plots a horizontal chart of trading volume at specific prices.
Read also: What is the Volume indicator? And its uses in financial markets
Test this indicator without risking capital
Reading about an indicator is not the same as watching it behave on a live chart. A demo account lets you apply the settings above to real market data and see how the signals form before any money is involved.
Advertising disclosure: partner link. Easy Trade may receive compensation. Educational content, not financial advice. CFDs carry a high risk of losing your capital.
Disclaimer: This article is for educational purposes only and does not constitute investment advice. Trading forex and CFDs involves leverage and carries a high level of risk to your capital; you can lose more than your initial deposit, and past indicator performance does not guarantee future results. This page may contain affiliate links, meaning we may earn a commission if you sign up through them, at no extra cost to you.