
50 Day Sma Forex Strategy

The 50-day simple moving average (SMA) is one of the most widely followed technical indicators for spotting trends in price action. Traders commonly use it to map support and resistance levels for stocks and currencies. It is popular because it is a practical, effective trend indicator.
Below is a 50-day SMA chart for the GBP/USD pair.
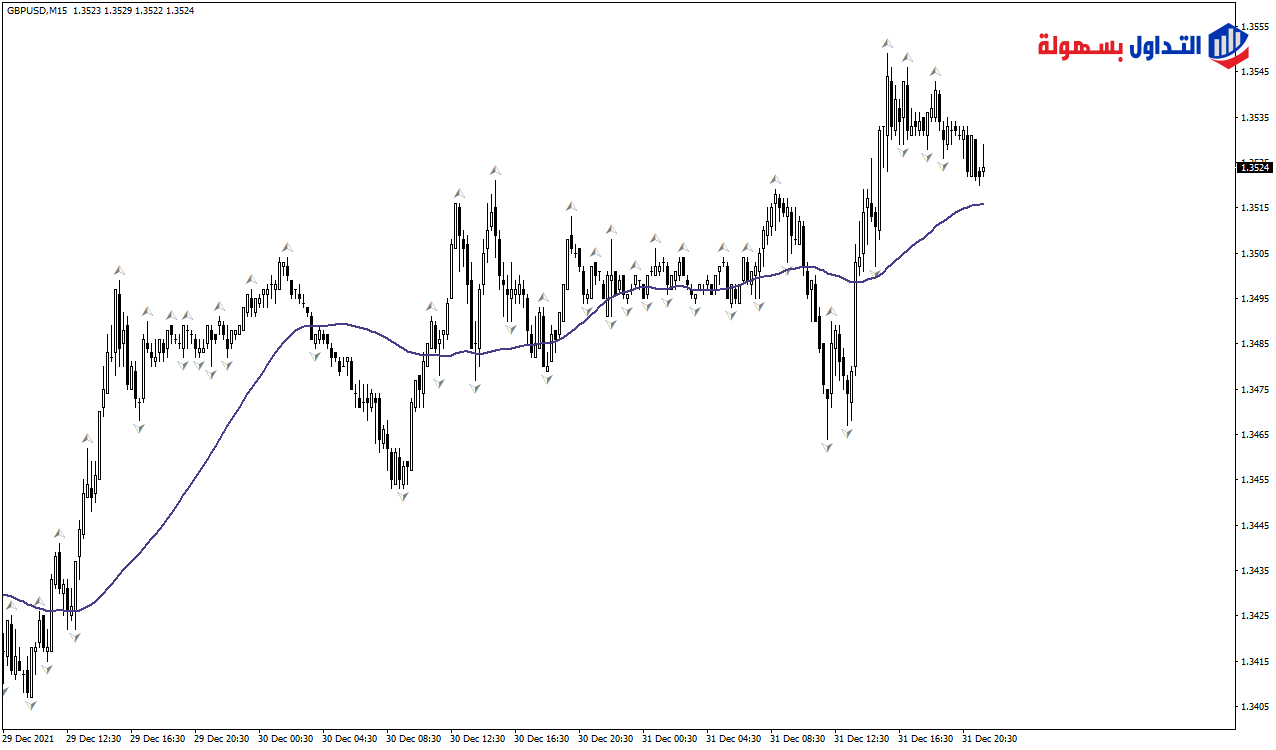
This type of average is a simple one used to examine price movement without the noise of daily price fluctuations, shown by the purple line in the chart above.
It is the average of the closing prices of stocks or currencies over the last 50 trading days, or ten weeks, plotted on the price chart.
You can see that it becomes a smoother line that reflects the direction of price movement. If it shows an uptrend, prices may rise gradually; if it shows a downtrend, prices fall.
How to calculate the moving average
You can calculate the 50-day moving average by adding the closing prices from the last ten weeks (day 1 + day 2 + day 3 … day n) and dividing the total by the number of days, n, which is 50. This is why simple moving averages are so widely used.
For a longer-term view of how prices move, all you need to do is add more days or periods and their closing prices. To calculate a 200-day moving average, you simply take the closing prices for 200 days, add them up, and divide by 200.
Read also: What is the moving average indicator?
Why the 50-day SMA matters
This average is a simple, effective, and strong indicator of price trends. It is common and hard to break during small price movements. Alongside a long-term moving average, it gives more substantial market signals.
A popular support and resistance level
Traders also view this type of average as a useful, effective benchmark for support and resistance. While it offers a historical view of price movement, it also reflects the prices at which investors bought and sold assets over the past ten weeks. It shows the range and direction of price movement.
Second, support and resistance points that fall along the 50-day line are often respected by day trading. These points are not broken easily, and prices usually bounce off support levels or pull back from resistance levels aligned with the moving average line. So it offers a good entry and exit point for traders, with fewer missed opportunities.
The 50-day SMA as support
Investors use this moving average as a support level, buying stocks when prices hover in the demand zone. The demand zone is where prices pull back from below the support level.
As more buyers step in at this stage, prices rise and climb back above the 50-day moving average. This moving average over 50 days offers a realistic support level.
The 50-day SMA as resistance
Traders place stop orders on short securities when prices start to break down as they enter the supply zone, or, with enough buying strength, they break through the 50-day moving average.
The upper ceiling of the supply zone matches this average. It takes enough buying strength to break through resistance levels, which makes it a reliable resistance level for placing exit trades, as 50-day moving averages usually coincide with the top of the range at which the stock trades.
Read also: The difference between the simple and exponential moving average

The 50-day SMA strategy
The 50-day SMA strategy is clear and direct. If prices cross the average as support and then bounce back, you can buy. If prices peak at this average as resistance and pull back,
you can consider selling short before a further decline. That is because it may take a lot of buying interest to push prices back above the 50-day moving average.
You can enter a trade when prices break out of the 50-day moving average in the direction of the breakout. For example, if there is an uptrend, you can buy at breakout levels and sell at the peak.
A price trend usually takes some time to reverse from the direction in which it broke out. You can always set a stop loss in the opposite direction to reduce potential losses.
This stop loss is useful if prices pull back because of unexpected events, government data releases, or a company’s financial disclosures.
How long should you hold this trade? Traders suggest a simple rule: hold the position until prices break the 50-day moving average in the direction opposite to your trade.
For example, if you bought, hold it until prices break in the other direction and cross the average in an upswing. And that wraps up our explanation of the 50-day SMA.
Try this strategy on a demo account first
A strategy that looks clear in an article can behave very differently under real spreads and volatility. Testing it on a demo account shows you how it performs before you commit any capital.
Advertising disclosure: partner link. Easy Trade may receive compensation. Educational content, not financial advice. CFDs carry a high risk of losing your capital.
Read also: The reversal zones strategy
Frequently asked questions
What does “moving average” mean?
A moving average is a statistic that captures the average change in a data series over time. In finance, technical analysts often use moving averages to track price trends for particular securities.
What is the difference between the simple and exponential moving average?
The exponential moving average (EMA) is similar to the simple moving average (SMA) in that it measures trend direction over a period of time. However, while the SMA simply calculates the average of price data, the exponential moving average applies greater weight to the most recent data.
What is the golden cross?
A golden cross occurs when a short-term moving average crosses above a major long-term moving average in an upward direction, and analysts and traders interpret it as signaling a decisive bullish turn in the market. Essentially, the short-term trend average rises faster than the long-term average until they cross.
What is the SMA indicator?
Moving averages are one of the core indicators in technical analysis, and there are many different versions. The simple moving average is the easiest moving average to build. It is simply the average price over the specified period.
Risk disclaimer: This article is for educational purposes only and is not investment advice. Trading forex and CFDs involves a high level of risk to your capital because of leverage, and it is not suitable for every investor. Technical indicators such as the 50-day SMA describe past and current price behavior; they do not predict future results, and any signal can fail. Do your own research and consider seeking advice from a licensed professional before trading.
Some links on this site may be affiliate links. If you open an account through them, we may earn a commission at no extra cost to you.