
Michigan Consumer Sentiment Index: How Traders Read It

The Michigan sentiment number is quoted twice a month and read as one figure. It is not one figure. The reading that arrives mid-month rests on roughly two fifths of the interviews behind the one that closes the month, and the survey it comes from collects far more than the index anyone quotes.
What follows is what the Surveys of Consumers actually ask, how the preliminary and final readings differ, which three series the release publishes, and what the leading-indicator claim rests on.
Key takeaways
- The survey is run at the University of Michigan by its Survey Research Center, and has been collected since 1946.
- Two readings are published each month. The mid-month one aims at roughly 420 cases; the closing one is normally built on about a thousand interviews.
- Addresses are drawn at random from the postal list covering the 48 mainland states plus Washington DC, which leaves Alaska and Hawaii outside the frame.
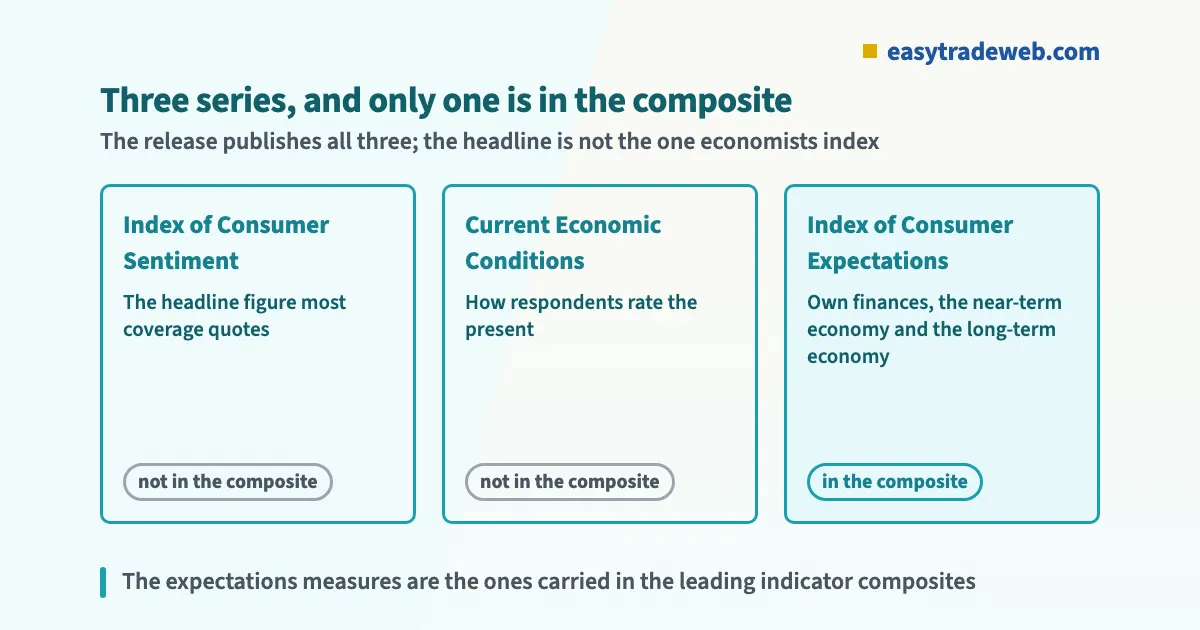
- The release carries three separate series: the Index of Consumer Sentiment, Current Economic Conditions, and the Index of Consumer Expectations.
- It is the Expectations series, not the headline, that economists carry inside the leading-indicator composites kept by the Bureau of Economic Analysis and by the OECD.
Table of contents
- What the Survey Actually Asks
- Two Prints a Month, and Only One of Them Moves the Screen
- The Sample: About a Thousand Interviews, Two States Left Out
- Sentiment, Expectations and Current Conditions Are Three Different Numbers
- The Inflation Questions Sitting Inside the Same Survey
- Why It Is Called a Leading Indicator, and What That Claim Rests On
- Reading It Beside the Hard Data
- What This Release Cannot Settle
- Frequently Asked Questions
What the Survey Actually Asks
Each monthly survey carries about 50 core questions, and every one of them tracks a different aspect of what consumers think and expect. The index that reaches a headline is built from a handful of them. The issuer is explicit that the Expectations series represents only a small part of the data collected each month.
The core questions cover three areas: personal finances, business conditions, and buying conditions. Under the first, the survey asks about changes already seen and changes expected, then adds items on family income in cash terms and in real terms.
Under the second it asks about the economy as a whole across both a short horizon and a long one. Under the third it asks how respondents rate present conditions for large household durables, for vehicles and for houses.
Two features of that design matter for anyone reading the print. The survey measures attitudes, not transactions, so nothing in it counts anything that has happened. And because it asks for reasons as well as answers, the published index compresses a much larger body of material into one line.
Two Prints a Month, and Only One of Them Moves the Screen
The release comes in two parts. A preliminary reading is published in the middle of the month and a final reading at the end of it, and the difference between them is sample size rather than method.
Roughly 420 cases are aimed at for the mid-month reading, and the exact number moves with the interview schedule. The closing reading of a month normally rests on about a thousand interviews. So the figure that arrives first, and takes the coverage, is built on around two fifths of the interviews behind the one that ends the month.
That asymmetry explains a pattern that otherwise looks odd on a chart. The mid-month print is the one that moves a screen, because it is the first new information; the month-end print, built on more than twice the interviews, usually passes with little reaction because most of what it says is already known. The more reliable of the two numbers is the less traded one.
A third date matters if you work with the data rather than the headline. The public series on the issuer site is released only after an embargo ending four weeks after that month’s final release date, so what you can download always lags what is being discussed.
The Sample: About a Thousand Interviews, Two States Left Out
Addresses are picked at random from the postal list covering the 48 mainland states together with Washington DC, a frame the issuer describes as yielding a nationally representative sample. Alaska and Hawaii sit outside it.
About a thousand interviews a month is a small sample beside the establishment and household surveys behind non-farm payrolls, and that is the appropriate comparison to hold in mind when a monthly move is described as significant. A sample of that size carries a sampling range around every reading, and a move inside that range is not evidence of anything.
The point is not that the survey is unreliable. It is that a one-month change and a trend across several months are different objects, and at this sample size only the second carries weight.
Sentiment, Expectations and Current Conditions Are Three Different Numbers
The release publishes three series, not one. The Index of Consumer Sentiment is the headline. Alongside it sit Current Economic Conditions, which asks how things stand now, and the Index of Consumer Expectations, which asks where they are going.

The Expectations series is built around three things: how respondents see their own finances going, how they see the wider economy on a short horizon, and how they see it on a long one. Current Conditions asks about the present instead.
Coverage treats all three as interchangeable readings of mood. They are not, and the two sub-series can move in opposite directions in one month. When they do, the headline is an average of a disagreement, and quoting it alone hides the more informative fact.
The Inflation Questions Sitting Inside the Same Survey
The survey carries questionnaire items on where respondents expect prices, joblessness and borrowing costs to go, alongside questions on their confidence in government economic policy. These supplement the broader assessments rather than feeding the headline index.
For a currency reader that is the part of the release with the clearest transmission. Expectations about future prices are one of the inputs a central bank watches, and a survey measure of them is one of the few published monthly. A move there speaks to the same question that the consumer price index report answers from the other side, with realised prices rather than expected ones.
The release converts none of that into a forecast. The items record what respondents said they expect; whether those expectations prove accurate is a question the survey does not attempt.
Why It Is Called a Leading Indicator, and What That Claim Rests On
The leading-indicator description is not a media label. The expectations measures from this survey are carried inside the leading indicator composite index built by the Bureau of Economic Analysis at the US Department of Commerce, and inside the OECD composite leading indicator constructed for the United States.
The selection is not arbitrary either. Every series admitted to that composite had to clear six published tests, and those tests fall into two groups: whether the series is meaningful and well measured at all, and whether it has behaved consistently against the turns of past cycles.
That is narrower than the label suggests. Membership says the series has behaved consistently around past turning points and arrives quickly enough to be useful. It does not say that any single monthly reading predicts anything.
| What differs | Preliminary reading | Final reading |
|---|---|---|
| When it is published | Middle of the month | End of the month |
| Interviews behind it | About 420 cases targeted | About 1,000 interviews |
| Method | Same survey, same questions | Same survey, same questions |
| Usual market attention | The one that moves a screen | Largely already known |
Reading It Beside the Hard Data
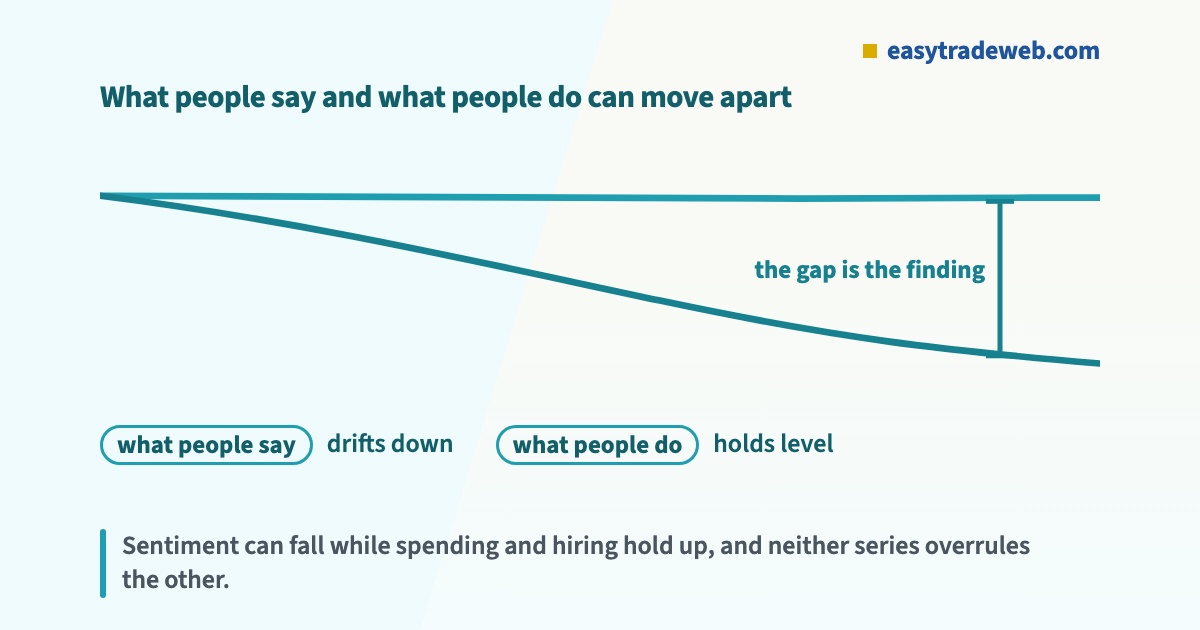
Attitude surveys and activity counts answer different questions, and the useful reading comes from putting them next to each other rather than choosing between them. When sentiment falls while spending and hiring hold up, the gap itself is the information: something is worrying respondents that has not yet reached their behaviour.
The practical version is a sequencing question. Check where this release sits against the harder releases in the same window on the economic calendar, and treat a sentiment move that contradicts the activity data as a question rather than an answer. That gap is also where a stagflation argument usually starts.
What This Release Cannot Settle
It cannot tell you what respondents will do, only what they said. It carries no threshold that is either met or not met, so nothing in it triggers anything. And with about a thousand interviews behind the full reading, a single monthly move is a weak object to build a view on. The claim it can support is about direction over several months, and no more than that.
Frequently Asked Questions
What does the Michigan consumer sentiment index measure?
It measures consumer attitudes, not activity. The monthly survey carries around 50 core questions covering personal finances, business conditions and buying conditions, and the published index is built from a small part of that material.
Why does the Michigan sentiment index print twice a month?
A preliminary reading is published mid-month and a final reading at the end of the month. The method is the same in both. The mid-month reading aims at roughly 420 cases and the closing one normally rests on about a thousand interviews.
Is consumer sentiment a leading indicator?
The expectations measures from this survey are carried inside the leading indicator composite index built by the Bureau of Economic Analysis, and inside the OECD composite leading indicator constructed for the United States. That reflects how the series has behaved around past turning points, and it is not a statement that any single monthly reading predicts anything.
Which part of the Michigan release matters most to currency markets?
No part of it carries an automatic effect. The questions on where respondents expect prices, joblessness and borrowing costs to go speak most directly to what a central bank watches, and the mid-month reading is the one that usually draws a market reaction because it arrives first.
Risk warning: this page is educational and explains how one survey is built and published. It is not advice to buy or sell any instrument, it recommends no product, platform or broker, and nothing here is a signal, a performance claim or a prediction. Leveraged trading carries a high risk of losing money rapidly.