
Dark Cloud Cover Pattern Explained

The Dark Cloud Cover is a bearish reversal candlestick pattern. The second candle opens lower, with its body or wick moving above the close of the prior large-bodied bullish candle, then closes below the midpoint of that bullish candle.
Read more: What is the Hammer pattern? A look at the well-known Hammer candlestick
This pattern matters because it shows a shift in momentum from an uptrend to a downtrend. It forms from a bullish candle followed by a bearish candle that reaches a higher price than the first, then closes at or beyond its midpoint. Traders then watch for the price to keep falling in the third candle, which is called confirmation. See the example below:
Key Points of the Dark Cloud Cover Pattern
As mentioned, the Dark Cloud Cover is one of the Japanese reversal candlestick patterns. It shows a shift in momentum toward the downside after a clear price rise. The pattern forms when a bearish candle opens after a large-bodied bullish candle, reaches a price above that prior bullish candle during the session, then closes below the midpoint of that bullish candle.
Both candles should have relatively large bodies, which points to strong participation from traders and investors. When the pattern forms with small-bodied candles, it is usually less significant.
Traders typically wait to see whether the candle following the bearish candle also shows a price decline. Any further drop in price after the bearish candle is called confirmation.
Understanding the Dark Cloud Cover Pattern
This pattern involves a large bearish candle that forms a “dark cloud,” reaching a price above the prior candle’s high, similar to the bearish engulfing pattern. Buyers push the price up at the open, but sellers take control by the end of the session and drive the price down sharply. This shift from buying to selling signals that a downside reversal may be near.
Most traders consider the Dark Cloud Cover useful only when it appears after a sharp uptrend or an overall price rise. As prices climb, the pattern becomes more significant as a signal of a possible move to the downside. If price action is choppy or sideways, the pattern carries less weight, since price is more likely to stay volatile and range-bound even after the pattern completes.
The Five Criteria for a Strong Dark Cloud Cover Pattern
- A strong uptrend.
- A bullish candle with a fairly large body within the uptrend.
- A gap above the price of the prior bullish candle, or a wick reaching above that prior bullish candle, before the second candle falls back down.
- The upward gap or upper wick turns into a bearish candle.
- The second bearish candle closes below the midpoint of the bullish candle before it.
The Dark Cloud Cover is marked by candles with long real bodies and relatively short or absent shadows. These features indicate that a downward move has become very imminent and significant in terms of price action.

Traders also look for confirmation in the form of a third bearish candle following the pattern, since price is expected to fall after the pattern forms. If confirmation does not occur in the third candle, that can signal the pattern may fail.
The close of the bearish candle can be used to place a stop-loss for sell trades and to close out existing buy positions, especially once the pattern is confirmed by a third candle. As with other Japanese candlestick patterns, there is no fixed profit target — traders use other methods, support and resistance levels, or indicators to time an exit from a sell trade or to set targets.
That is why it is important for traders to use the Dark Cloud Cover alongside other forms of technical analysis, such as the Relative Strength Index (RSI), which can help confirm that a security is at a price extreme. A trader might also look for a price breakdown from a key support level following the pattern as a signal that the downtrend could be strong. Here is an example of the Dark Cloud Cover pattern:
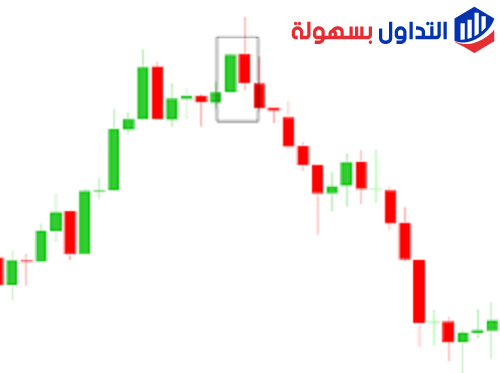
In this example, the pattern occurred when a bearish candle — following a large-bodied bullish candle within a strong uptrend — opened higher and closed below the midpoint of that bullish candle. In this example, the pattern was followed by a pullback in the next candle, in which price fell by about seven percent, and that candle served as confirmation.
Traders holding a buy position could exit near the close of the bearish candle or on the following confirmation candle, and begin taking sell trades as price continued to decline.
When entering a sell trade, an initial stop-loss can be placed above the high of the bearish candle following the confirmation candle, and the stop can then be lowered to just above the high of that confirmation candle. Traders then set a downside profit target using other methods, strategies, and indicators to track the continued decline in price.
In summary, the Dark Cloud Cover is a useful signal for traders as a possible reversal to the downside, though it is not as strong a signal as the more powerful bearish engulfing pattern. Even so, the Dark Cloud Cover remains a useful bearish indicator to watch, especially when it forms on a larger timeframe chart such as the daily chart; on lower timeframes, its significance drops considerably.
Read more:
- The High Wave Candle pattern
- What is the Inverted Hammer pattern?
- A look at the most well-known Japanese candlestick patterns
Disclaimer: This article is for educational purposes only and does not constitute investment advice. Candlestick patterns such as the Dark Cloud Cover are tools for reading price action; they can fail, and past examples do not guarantee future results. CFDs and leveraged trading carry a high risk of losing money rapidly. This page may contain affiliate links; Easy Trade may earn a commission at no extra cost to you if you use them.