
Double Top Pattern Explained

The double top pattern is one of the technical chart patterns considered among the easiest methods of technical analysis, and it is very popular with most forex traders, especially those who follow the classical technical analysis school. You may also want to read about Cypher Harmonic Pattern Rules.
Today we’ll shed light on one of the most important and widely used of these patterns: the double top pattern, which is classified as a reversal pattern. Let’s get to know it, its types, and how to use it.
What Is the Double Top Pattern?
There are two types of this pattern:
Double Top Pattern
This is one of the reversal patterns that signals a change in direction from an uptrend to a downtrend. Its shape resembles the letter M. The pattern consists of two consecutive peaks separated by a single trough. The figure below illustrates it.
Bearish double top pattern
Double Bottom Pattern
This is one of the reversal patterns that signals a change in direction from a downtrend to an uptrend, and it takes the shape of the letter W. This pattern consists of two consecutive troughs separated by a single peak. The figure below represents the double bottom pattern.
This pattern is very popular with traders who prefer long-term trading, because it offers opportunities with a high reward-to-risk ratio that can sometimes reach 1:3. The double top pattern is also easy to spot on the chart,
so you don’t need to be a professional to identify it, unlike some other patterns such as harmonic patterns and Elliott waves, which require certain measurements to confirm the pattern is valid.
Read also: AB=CD Pattern, One of the Best Harmonic ABCD Patterns
How to Trade the Double Top Pattern
Double Top Confirmation Signal
Every technical pattern must have a confirmation signal indicating that the pattern is ready to trade. This certainly applies to the double top pattern, since it is a technical pattern. The confirmation signal in this pattern is a break of the trough in the case of the double top pattern, and a break of the peak in the case of the double bottom pattern.
The image below shows the breakout that occurred on the double top pattern.
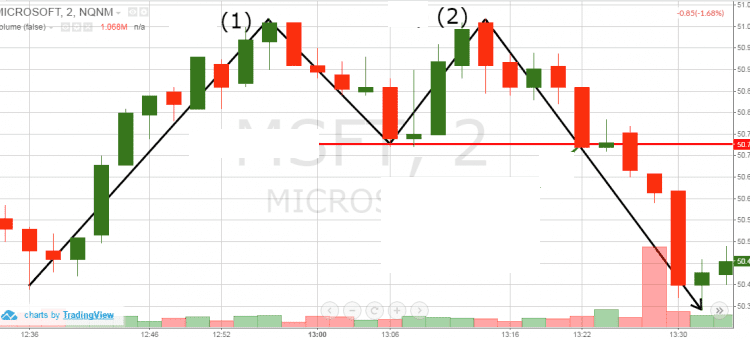
The chart above shows the price chart of Microsoft stock at the start of 2016. You’ll notice the price initially began rising, forming the first peak,
then it declined slightly, forming the trough between the two peaks, after which it rose again to form the second peak. At this point, it can’t yet be confirmed that the pattern is complete and ready to trade. Notice that we drew a line at the trough between the two peaks — once this line breaks,
you can consider entering sell trades, which is exactly what happened: you’ll notice the price collapsed as soon as this level broke.
Double Top Pattern Target
Once you’ve confirmed the pattern is complete and ready to trade, the last thing you need to know is the target price the price is expected to reach based on the double top pattern. The expected target for this pattern equals the size of the pattern itself. This might sound confusing — don’t worry, the following example will make it clearer.

The chart above shows the price chart of Hewlett-Packard stock at the start of 2016. You’ll notice two shaded blue boxes: the first represents the size of the pattern, and the second represents the target the price is expected to reach.
Risk Management on the Double Top Pattern
Now to the most important part of this article: risk management. As you know, risk management is the only guarantee of staying in the market for as long as possible, so you should focus on this part as much as you can.
Many traders claim that when trading the double top pattern, the stop loss should be placed above the second peak of the pattern. In reality, this carries a high level of risk, because if you place your stop loss above the second peak of the pattern,. To turn the explanation into an actual figure, calculate the size that fits your risk.
the profit-to-loss ratio will be less than 1:1 — and the success rate of the double top pattern is 65%-70%, meaning if you win one trade, you can expect to lose the next, and you’ll end up closing your trades with no profit, or with some losses.
For this reason, the stop loss should be placed close to the entry point. For example, you could place the stop-loss order above the candle preceding the entry candle, or at half the distance of the pattern’s size.
This is the best approach to risk management on the pattern using this method — you’ll get a profit-to-loss ratio of at least 1.8:1, which makes trading this pattern profitable. Let’s take an example.
Read also: Tips Before Managing Your Capital in Your Trading Account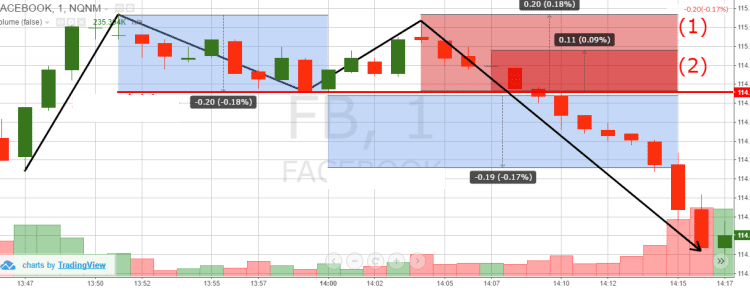
The chart above shows the price chart of Facebook stock at the start of 2016. You’ll notice the formation of the double top pattern. The red boxes mark the stop-loss levels at points 1 and 2. At point 1, notice that the stop-loss size equals the target size, i.e. a ratio less than 1:1, approximately equal to 1:80.
At point 2, notice that the stop-loss size is about half the target, i.e. a ratio equal to 1.94:1.
From the above, it’s clear that it makes more sense to use the second stop-loss order.
Double Bottom Pattern
The double top pattern has an identical twin: the double bottom pattern, as mentioned above. Everything discussed above can be applied to the double bottom pattern, but in the opposite direction. Let’s take an example.
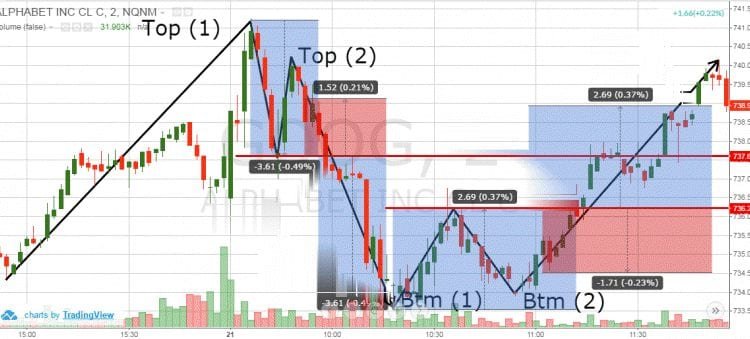
The chart above shows the price chart of Google stock from the start of 2016. After the double bottom pattern formed and the confirmation signal appeared, we entered a buy trade.
After that, we set the target equal to the size of the pattern, and set the stop-loss order at half the size of the pattern. You’ll notice the risk-to-reward ratio is approximately 1:1.70.
Read also: What Is the 123 Pattern? Explanation and Example of the Rising and Falling PatternConclusion
The double top pattern is a strong bearish technical reversal pattern that forms after an asset reaches a high price twice in succession, with a moderate decline between the two peaks. The double top pattern is confirmed once the asset’s price falls below a support level equal to the lowest point between the previous peaks. Here are the key points for using it:
- Double top pattern: one of the reversal patterns that signals a change in direction from an uptrend to a downtrend. Its shape resembles the letter M. The pattern consists of two consecutive peaks separated by a single trough.
- Double bottom pattern: one of the reversal patterns that signals a change in direction from a downtrend to an uptrend, and it takes the shape of the letter W. It consists of two consecutive troughs separated by a single peak.
- The double top pattern can be found on all timeframes.
- The trough between the two peaks in the double top pattern marks the signal line.
- When the price breaks the signal line after the second peak forms, we get confirmation of the pattern.
- The target price of a double top pattern in length equals the size of the pattern.
- The risk size you use when trading the double top pattern should be smaller than the pattern’s size in length — this way you’ll get a profit-to-loss ratio greater than 1:1, making your strategy on the double top pattern more profitable.
- The identical twin of the double top pattern is the double bottom pattern. All the rules discussed apply to it fully, but in the opposite direction.
Test this indicator without risking capital
Reading about an indicator is not the same as watching it behave on a live chart. A demo account lets you apply the settings above to real market data and see how the signals form before any money is involved.
Advertising disclosure: partner link. Easy Trade may receive compensation. Educational content, not financial advice. CFDs carry a high risk of losing your capital.
Disclaimer: This article is for educational purposes only and does not constitute investment advice. Chart patterns such as the double top and double bottom reflect historical price behavior and do not guarantee future results. Trading forex and CFDs involves substantial risk, including the risk of losing more than your initial investment, and leverage can amplify both gains and losses. Always test any strategy on a demo account and manage your risk carefully before trading with real funds. Some links on this site may be affiliate links, meaning we may earn a commission at no extra cost to you if you open an account through them.