
Elliott Wave Cycles and Degrees

Elliott Wave theory. Have you heard this name before? If you trade or follow the markets, you have almost certainly come across this theory, since it is a well-known framework that investors use and one that influences trading decisions.
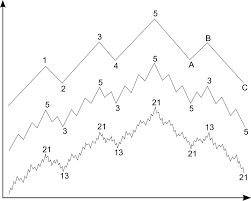
Elliott wave labeling
Test this indicator without risking capital
Reading about an indicator is not the same as watching it behave on a live chart. A demo account lets you apply the settings above to real market data and see how the signals form before any money is involved.
Advertising disclosure: partner link. Easy Trade may receive compensation. Educational content, not financial advice. CFDs carry a high risk of losing your capital.
Elliott waves are named after Ralph Nelson Elliott (28 July 1871 – 15 January 1948), an American accountant and author. Elliott drew on Dow theory and the observations within it, and concluded that stock market movement could be predicted by observing and identifying a recurring wave pattern.
Elliott was able to analyze markets in greater depth, define the specific characteristics of wave patterns and make detailed market forecasts based on these models. Part of his work was also built on Dow theory, which likewise defines price movement in terms of waves, but Elliott discovered the numerical nature of market movement.
The Basic Principle of Elliott Wave Theory
- Simply put, movement in the direction of the trend unfolds in 5 waves (called the motive wave), while any correction against the trend unfolds in three waves (called the corrective wave). The movement in the direction of the trend is labeled 1, 2, 3, 4 and 5. The three-wave correction is labeled A, B, C. These patterns can be seen over the long term as well as the short term.
- On the other hand, smaller wave patterns can be identified within larger wave patterns. In this sense, Elliott waves become simpler to read through this information (about smaller wave patterns fitting within larger wave patterns), together with the Fibonacci pattern, labeling and degree relationships between the waves, which give a trader a level of anticipation and prediction when looking for and identifying trading opportunities with strong profit ratios away from risk.
Types of Elliott Waves (Impulse and Corrective)
In Elliott’s model, market prices alternate between an impulsive phase and a corrective phase across all time scales of the trend. Waves always divide into a group of 5 waves of the next lower degree, again alternating between the impulsive and corrective phase, so that waves 1, 3 and 5 are impulsive, while waves 2 and 4 are smaller corrections of waves 1 and 3.
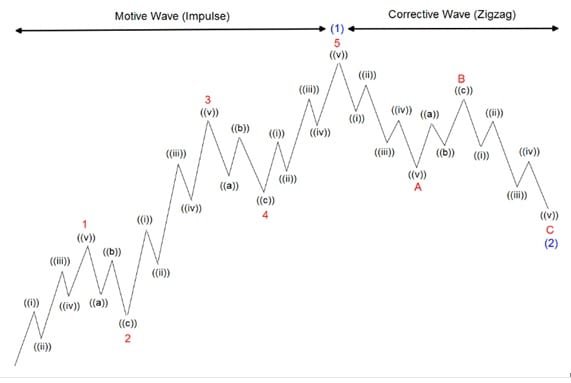
The five-wave Elliott pattern for impulse and corrective waves
In the figure above, waves 1, 3 and 5 are impulse waves and each divides into 5 waves of a smaller degree labeled (i), (ii), (iii), (iv) and (v). Waves 2 and 4 are corrective waves and each divides into 3 waves of a smaller degree labeled A, B and C. The five waves in waves 1, 2, 3, 4 and 5 together move to form an impulse wave of a larger degree (1).
The corrective waves divide into 3 smaller waves, denoted ABC. Corrective waves begin with a five-wave move against the trend (wave A), a pullback (wave B), and another motive wave (wave C). Together, the three waves A, B and C form a corrective wave of a larger degree (2).
In pattern and numbering terms, in a bear market the prevailing trend is downward, so the pattern is reversed: five waves down and three waves up.
Elliott Wave Degree
Wave degree is one of the languages of Elliott wave theory used to define cycles, so that an analyst can locate a wave within the market’s overall progress. Elliott recognized 9 degrees of waves, from the Grand Supercycle degree, typically found on weekly and monthly timeframes, down to the Subminuette degree found on the hourly timeframe. The chart below is used across all Elliott wave charts.
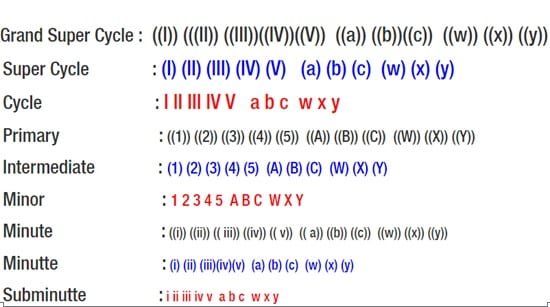
Chart of Elliott wave labeling and degrees
The Rise of Computer-Based Digital Trading
The development of computer and internet technology is perhaps the single most important advance shaping and defining the current century. The spread of computer- and algorithm-based trading has given rise to a new class of traders who trade based on techniques, probabilities and statistics rather than human emotion. In addition, these systems trade at extremely high speed, in seconds or even fractions of a second, executing buy and sell orders based on previously recorded trading patterns.
The trading environment we face today is undoubtedly very different from the one that existed in the 1930s, when Elliott first developed the wave principle, which raises legitimate questions about whether Elliott wave principle can still be applied in today’s new trading environment.
The New Elliott Wave Principle and What Is Changing in the Market Today
- First, you should know why this theory carries this name: it is named after Ralph Nelson Elliott because, as mentioned, he founded it, and the theory developed during the years between 1930 and 1940 by this young man.
- He observed that market prices fluctuate, or move, in successive patterns, or within successive series of specific models. Each model contains a wave that has a length and a time, and each wave in turn is made up of smaller waves, and whenever one of these waves completes, it is called a cycle.
- From the above, we conclude that Elliott waves are a form of technical analysis of the financial market, based on the idea that knowing past patterns points to the future, and Elliott waves are considered one of the most important tools that help with technical analysis of the financial market.
- The biggest change in the market today compared with the market in the 1930s lies in identifying the trend and the counter-trend move. We have four main market categories: the stock market, foreign exchange, commodities and bonds. Elliott wave theory was originally derived from observing the stock market (i.e. Dow theory), but some markets such as forex currently display more than one market at once.
- In today’s market, a 5-wave move still occurs, but our years of observation indicate that the three-wave move happens more frequently in the market than the 5-wave move. In addition, the market can continue moving in a corrective structure in the same direction.
- In other words, the market can trend in a corrective structure, continuing to move in a sequence of 3 waves, pull back, then continue in the same direction again in a corrective move of 3 waves. So we believe that in today’s market, trends do not have to unfold in 5 waves, and trends can unfold in 3 waves; therefore it is important not to always force 5 waves when trying to find the trend and label the waves on a chart.
In the following explanation, we will cover:
- Cycle time
- The nature of wave movement
- Degree and labeling
First: Cycle Time

Elliott, and those who developed his theories after him, classified waves according to their completion time into categories and specific patterns, as shown in the following table:
Table 1
We will use the information in this table in the explanation of degree and labeling.
Second: Elliott Waves (the Nature of Wave Movement)
Forms of wave movement and their general rules.
We covered in the previous table that we have eleven cycles, from (0 to 10). Elliott, and those who continued the development after him, explained that each of these cycles moves in 8 waves: 5 of them are called impulse waves, and the other three are corrective waves.
The impulse waves that make up Elliott waves are five waves that move in a thrusting manner, three of them in the general direction (1, 3, 5) and two against the general direction (waves 2, 4), so the movement is as follows:
- Wave 1: in the general direction
- Wave 2: against the general direction
- Wave 3: in the general direction
- Wave 4: against the general direction
- Wave 5: in the general direction
The odd-numbered waves 1, 3, 5 are called thrust (motive) waves, and the even-numbered waves 2, 4 are called limited waves.
Corrective waves: the corrective waves that make up Elliott waves begin after impulse wave number 5 ends, and these waves move to correct the impulse waves.
These are waves A, B, C, and they are the reverse of the previous waves: in the impulse waves, wave 1 started in the general direction, then wave 2 against the general direction.
In these corrective waves, it will be as follows:
- Wave A: against the general direction
- Wave B: in the general direction
- Wave C: against the general direction
The following figure shows the complete cycle and the eight waves that form it:
Figure 1
The “general direction” does not mean an uptrend specifically; it can be up or down.
The internal waves of a wave:
We mentioned earlier that each Elliott wave is made up of smaller waves inside it, which in turn form a cycle, and the smaller waves inside the cycle are arranged as follows:
- Wave 1: made up of 5 waves
- Wave 2: made up of 3 waves
- Wave 3: made up of 5 waves
- Wave 4: made up of 3 waves
- Wave 5: made up of 5 waves
These are the impulse waves.
As for the corrective waves, they are as follows:
- Wave A: 5 waves
- Wave B: 3 waves
- Wave C: 5 waves
The following diagram shows the shape of the internal waves of one complete simple cycle:
Figure 2
We can see from the figure above that each wave is made up of internal waves, and each of these internal waves in turn contains smaller, finer waves, and this applies across all eleven cycles.
Third: Elliott Wave Conditions for a Single Wave (Cycle)
- Wave 2 must be shorter than wave 1 – in an uptrend, wave 2 must not drop below the start of wave 1, and in a downtrend, wave 2 must not rise above the start of wave 1.
Figure 3
- Wave 3 must not be the shortest wave among the thrust waves 1, 3 and 5.
Figure 4
- Wave 4 must not overlap wave 2 in the same price zone (that is, wave 4 must not drop into the territory below the low of wave 1 in an uptrend, nor rise below the value of wave 1 in a downtrend).
Figure 5
The Nature of the Positive Wave Movement of Elliott Waves
We mentioned earlier that a wave is made up of impulse waves and corrective waves.
Types of Impulse Waves
There are two basic types of impulse waves:
- The impulse wave.
- The diagonal triangle wave, which is divided into:
- Leading diagonal
- Ending diagonal
1- The Impulse Wave
This is the simple and most common form of the impulse waves, made up of five internal impulse waves followed by the three other corrective waves, and by the end of wave 5 the impulse wave has completed within a larger cycle, as shown in the figure:
Figure 6
Rules of the impulse wave:
1- Wave 1 must be a leading diagonal triangle or an impulse wave.
2- Waves 2 and 4 cannot be impulse waves, and may include any corrective pattern.
3- Wave 2 must be shorter than wave 1, and it usually corrects a maximum of 74.6% to 79% of wave 1.
4- Wave 3 must be impulsive and longer than wave 2, and wave 3 is usually 161.8% to 262.8% of the length of wave 1.
5- Wave 4 does not enter the price zone of wave 2 (the non-overlap principle).
6- Wave 5 must be a trailing diagonal triangle, or an impulse wave, and must form at least a 2% ratio from wave 4.
7- Alternation must occur between wave 2 and wave 4.
8- Extensions occur in one of the impulse waves 1, 3 or 5.
The Alternation Property:
This is a property that occurs between wave 2 and wave 4 of the impulse waves, meaning a difference between the two waves in terms of:
Time: the time taken by the end of wave 4 is shorter or longer than that of wave 2.
Price: one of waves 2 and 4 is longer than the other in price.
Pattern shape: the corrective pattern of wave 4 differs from the pattern of wave 2, and vice versa – for example, wave 4 may be a simple pattern while wave 2 is a contracting-triangle pattern.
Such as a zigzag ABC, and alternation occurs in at least one of these points, or in all of them, as shown in the following figure:
Figure 7
Extension:
This occurs in one of the impulse waves, and results from the nature of the market when it is in a strong trend and demand for it starts increasing, resulting from underlying causes. The following figure shows examples of extension:
Figure 8
2- The Diagonal Triangle Wave
a- The Leading Diagonal Wave:
This wave sometimes occurs at the start of the impulse waves, in wave 1, and needs five waves to complete. Its waves are as follows:
- Wave 1: made up of 5 waves
- Wave 2: made up of 3 waves
- Wave 3: made up of 5 waves
- Wave 4: made up of 3 waves
Wave 5: made up of 5 waves
This wave forms as a result of the conflict between sellers and buyers (in the case of an uptrend), and Figure 9 below shows an example of a leading diagonal triangle:
Figure 9
b – The Ending Diagonal Wave:
This is a wave that occurs at the end of the impulse wave, in wave 5, and hence it is called the “ending” wave because it comes at the end of the leading wave.
It is similar to the leading diagonal wave, but its internal wave structure is made up of three-wave moves, as shown in Figure 10.
Figure 10
Rules of the Diagonal Wave:
1- Wave 1 can be a non-triangle pattern.
2- Wave 2 can form any pattern, but it cannot drop below wave 1, and it is usually a sharp wave in the opposite direction.
3- Wave 3 can also form any pattern other than triangles, but it must be longer than wave 2.
4- Wave 4 can form any shape, and is usually a sideways wave.
5- Wave 5 can form any shape, but must be a ratio of 38.2% of wave 4 and shorter than waves 1 and 2.
The Nature of Wave Movement
Types of Correction Waves:
These waves move against the general direction and begin at the end of the impulse waves of a cycle. Traders track the end of these corrective waves so as to re-enter the market for a push in the general direction, and there are 8 known correction patterns.
- The zigzag wave:
In this wave, the internal wave composition is as follows:
- Wave A: five waves
- Wave B: three waves
- Wave C: five waves
Figure 11
- The flat wave pattern:
Its internal waves are composed as follows:
- Wave A: three waves
- Wave B: three waves
- Wave C: five waves
Figure 12
Wave B is often the shortest wave in this pattern, though in some cases wave B extends to as much as 138.2% of wave A.
3- The Double Zigzag Pattern:
The following figure shows the pattern and its internal waves:
Figure 13
4- The Triple Zigzag Pattern:
This resembles the double zigzag pattern, but has 3 zigzag series, each separated by an X wave.
5- The Double Three Pattern:
Figure 14
6- The Triple Three:
Figure 15
7- The Contracting Triangle:
Contracting triangles are made up of five waves until ABCDE completes, and there are three basic types:
The ascending triangle:
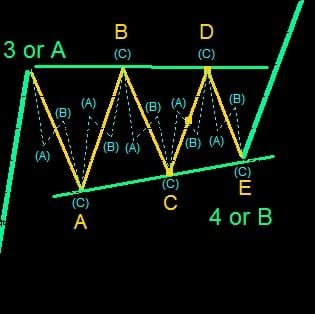
Figure 16
The descending triangle:

Figure 17
- The expanding triangle pattern:
The clear difference from the contracting triangle is that this triangle starts converging and then diverges, so wave E ends up being its longest wave.
 Figure 18
With that, we have covered the eleven Elliott wave patterns, made up of three impulsive-type patterns and eight corrective-type patterns.
The quick correction:
Figure 19
Fourth: Labeling Elliott Waves
Here we will look at the principles of wave labeling and how to distinguish between the different degrees.
- Degree:
A wave’s degree is determined by the cycle it belongs to: waves at the Cycle degree are smaller than waves at the Supercycle degree, and in turn larger than the Primary degree, and so on.
To get a complete wave of a larger degree, the waves of each degree must be grouped and their type identified so that labeling is correct – or, the reverse, by identifying a larger wave first and then identifying the waves it contains.
This task is not an easy one, since there are no fixed time constants for how long a wave at a given degree takes.
Nor do we have fixed price constants to measure against, so classification by wave labeling follows reversals and oscillations up and down, which is what forms the waves, in addition to the influencing factors of time and price between waves of the same degree.
- Labeling degrees:
This splits into two parts: the first is (labeling historical waves), and the second is (building future forecasts and labeling live waves).
Labeling historical waves:
By historical waves, we mean waves that have already completed.
Some points we need when labeling waves:
- The timeframe on which the wave’s details appear:
Timeframes are one of the tools we can use to label waves. When labeling an impulse wave (in an uptrend) on a 1-minute chart, it will usually be represented by one or more candles, or bars, on a 5-minute chart.
When we see a lower candle on the 5-minute chart, we know that the rising impulse wave we had been watching on the 1-minute chart has ended (i.e. the end of wave 5), and the same applies to the rest of the relationships between timeframes, which is why the close of each timeframe carries great importance.
- Internal corrections of the wave:
This is movement against the direction of the wave’s movement, and it can be considered a wave if it reaches the minimum corrective percentage for the pattern, estimated at around 14.6% in impulsive waves.
- Length of the corrective wave:
The length of the corrective wave often indicates the type of wave it belongs to: corrective waves between 14.6% and 38.2% mostly belong to impulsive waves, while corrective waves reaching around 50% or beyond can belong to either impulsive or corrective waves.
Figure 20
- Overlap between waves:
This can be broken down by type as follows:

1- Overlap after a three-wave move:
At the start of a three-wave move in a defined direction, wave 4 overlaps with wave 1, and in that situation there are several possibilities for the wave that encompasses them, for example (an impulse wave with an extended third wave – a zigzag wave – a flat diagonal wave).
Deciding between these possibilities depends on several factors, such as the type of the preceding wave and the correction ratio of wave 2.
2- Compound overlaps:
These overlaps occur in compound corrective waves such as double waves, triangular waves and similar patterns, forming peaks and troughs that sit close to one another, and the market may then start moving sideways.
- Labeling extensions:
There are some difficulties in labeling waves because they often extend, and it can also be difficult to distinguish the details of a wave, but it should be kept in mind that an impulse wave is originally made up of five internal waves.
Each of waves 1, 3 and 5 can extend so that it becomes made up of five other waves of a degree larger than that of the internal waves within the same wave.
This means that if one of these internal waves extends within an impulse wave, its actual wave count becomes 9 waves, and if one of those in turn extends, its actual wave count becomes 13 waves, and so on.
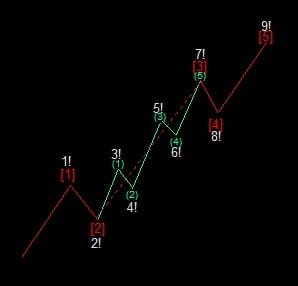
Figure 21
Figure 22
The details of a wave must be considered carefully when labeling, because any labeling error for the internal waves can lead to a wrong decision about future internal reversal moves or about the end of the wave.
To label a wave briefly, the following important points must be considered:
- Confirm that the wave from which labeling will start is a five-wave move.
- Look for an extension of the third wave if waves 1, 2, 3 started and the fourth wave overlaps.
- If the third wave is the shortest during labeling, look for an extension of one of the impulse waves.
- From the explanation above, it is clear that there are several considerations to take into account if you have no background in Elliott waves – in that case, you should run a trial count, or watch charts and technical analysis until you gain enough experience.
Elliott wave theory can seem somewhat complex to you at first, but with time and repeated practice you will master it and become skilled at it. It takes patience at the start, and I will be honest with you – it is not entirely easy – but the effort pays off, since Elliott theory produces remarkable results when compared with other theories, and finally, remember that Wall Street’s biggest players rely on Elliott theory in their analysis.
Finally, keep in mind that Elliott waves are observed by a trader when a stock, currency or commodity moves upward in an impulse wave, and at that point the trader may buy the asset in order to ride it through the completion of wave 5.
At that stage, anticipating a reversal, the trader may then sell the asset, since Elliott wave trading is built on the idea that fractal patterns repeat in financial markets, based on the mathematical principle that fractal patterns repeat themselves across an infinite scale.
Frequently Asked Questions
What is the difference between a directional wave and a corrective wave?
Directional waves, also called impulse waves, are the waves that form in the direction of the general price movement, while corrective waves, or correction waves, are the waves that form to correct the overall price movement.
How are Elliott waves labeled?
Elliott waves are labeled through a cycle made up of 8 waves, of which 5 are directional waves and 3 are corrective waves, with each group of waves labeled as a single wave within a larger cycle.
Why are Elliott waves important for stock trading?
Elliott waves are one of the analysis tools that help a trader follow and understand price movement and predict its future direction in order to make sound buy and sell decisions.
Is learning Elliott waves easy and simple?
Elliott waves can be learned through various sources of knowledge, such as books and articles, to build the basic skills, which can then be developed further through hands-on practice.
What is the basic concept behind Elliott wave theory?
Elliott waves are a technical analysis method for securities market trends, based on specific data used to track price changes and build forecasts for their future movement using this data.
How many waves make up a complete Elliott wave cycle?
Each Elliott wave cycle is made up of 8 waves, including 5 waves that form in the general direction and 3 waves that form to correct the price movement.
Disclaimer: This article is for educational purposes only and does not constitute investment advice or a recommendation to buy or sell any financial instrument. Elliott Wave analysis is a subjective technical method and does not guarantee future price movement. Trading CFDs and leveraged products carries a high level of risk and can result in losses that exceed your deposited capital; most retail investor accounts lose money when trading CFDs. This page may contain affiliate links, meaning we may earn a commission if you sign up with a broker through one of our links, at no extra cost to you. Always do your own research and consider seeking independent financial advice before trading.