
Types of Corrective Waves

Before getting into the details of corrective waves, we first need to define Elliott waves. Elliott Wave theory proposes that stock prices move up and down continuously in the same recurring pattern, known as waves, which are shaped by traders’ psychology and sentiment.
This theory of corrective waves holds up well because these are recurring patterns, and they are used to help estimate probable stock price movements.
Investors can also gain useful insight into the ongoing trend by watching corrective waves, which helps with deeper analysis of price movements.
Traders should keep in mind that interpreting Elliott waves is a subjective matter, since investors read them differently depending on their own view and analysis. Before discussing the patterns specific to Elliott waves, let’s look at impulse waves and corrective waves behind them.
Test this indicator without risking capital
Reading about an indicator is not the same as watching it behave on a live chart. A demo account lets you apply the settings above to real market data and see how the signals form before any money is involved.
Advertising disclosure: partner link. Easy Trade may receive compensation. Educational content, not financial advice. CFDs carry a high risk of losing your capital.
What Are Impulse Waves and Corrective Waves?
An Elliott wave can be classified into impulse waves and corrective waves. Impulse waves move in the direction of the main trend and are made up of 5 waves called wave 1, wave 2, wave 3, wave 4 and wave 5.
Waves 1, 3 and 5 move in the direction of the main trend, while waves 2 and 4 move in the opposite direction. There are usually two types of impulse waves: motive waves and diagonal waves.
Corrective waves, on the other hand, are defined as waves that move against the main trend. Corrective waves are more complex and take longer to complete than impulse waves.
Corrective waves are made up of three waves, labeled A, B and C. The three main types of corrective waves are zigzag, flat and triangle waves, which we will look at below:
Types of Corrective Waves:
These are a set of price movements in financial assets tied to Elliott Wave theory in technical analysis, with the following key points about how they form:
- Types of corrective waves are price movements typically tied to Elliott Wave theory.
- The underlying movement of corrective waves runs opposite the main trend, to a greater degree.
- Corrective waves are usually made up of three sub-waves.
Understanding the Types of Corrective Waves
Elliott Wave theory holds that price movements in securities and forex markets split into two types of waves: impulse waves and corrective waves. Both types can be used to identify price trends in securities, forex markets, CFDs, cryptocurrencies and so on.
Within the wave model, impulse waves move with the trend to a greater degree, while the types of corrective waves move in the opposite direction.

The types of corrective waves are also an important component of Elliott Wave theory, developed by Ralph Nelson Elliott in the 1930s.
Elliott Wave theory offers useful insight into the trends and patterns of financial market prices, forex, CFDs, ETFs, stocks, bonds, cryptocurrencies and more. Below is a typical Elliott wave chart shape in a rising market.
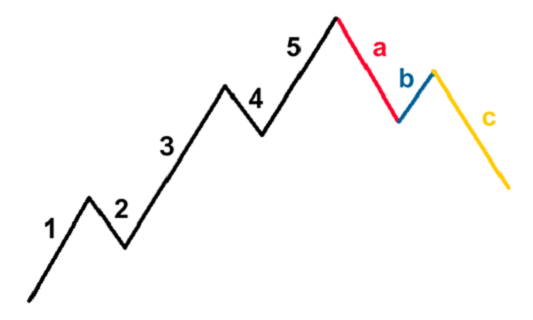
Because we always use a rising market as our main example, this does not mean that Elliott Wave theory and the types of corrective waves do not form in falling markets too — they do, as shown in the following figure:
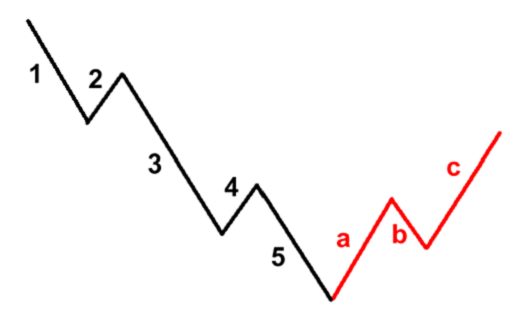
Types of corrective waves run opposite the main trend in both movement and strength, to a large degree, and corrective waves are usually made up of three sub-waves, A, B and C.
Read also: Complex correction rules in Elliott waves
Types of Corrective Waves According to Elliott
According to Elliott, there are 21 patterns among the types of correction waves that form the ABC correction model, ranging from simple to complex — known as the complex correction rules in Elliott waves.
The fact that there are 21 models or patterns among the types of correction waves does not mean you have to memorize all of them! The fundamentals of Elliott Wave theory are genuinely straightforward, and you’ll only need to know three of the corrective waves — the basic ones, and the most common in market charts — known as Elliott wave correction ratios.
So keep it simple, because the great thing about Elliott waves is that you don’t have to know all of them to trade with them.
You also don’t need rare patterns, or to memorize all 21 types of ABC corrective patterns, because they come down to three very simple, easy-to-understand main formations.
Below, we look at these three formations applied in the examples below to uptrends — you can simply reverse them if you’re dealing with a downtrend.
Read also: Learn about the types of trading charts in detail
Zigzag Correction
Zigzag patterns (or zigzag waves) are sharp declines or rises in price that run against the prevailing main trend, and wave B is usually shorter than waves A and C.
These zigzag patterns can occur twice, or even three times, within a single correction — meaning 2 to 3 linked zigzag patterns can appear.
As with all waves, each of the waves within a zigzag pattern can be broken down into 5-wave patterns.
Flat Correction
Flat waves are simple sideways corrective waves, as shown in the figure above. Wave lengths are generally roughly equal, with wave B retracing wave A’s move and wave C retracing wave B’s move. Generally speaking, wave B can sometimes extend beyond the start of wave A.
Triangle Correction
Triangle corrective waves are corrective patterns linked to either converging or diverging trendlines. Triangles in Elliott waves are made up of 5 waves that move against the trend in a sideways fashion, and these triangle waves can be symmetrical, descending, ascending or expanding.
Overall, Elliott Wave theory offers a clear framework that can help technicians monitor and understand financial asset price movements over both the short and long term. According to the theory, both impulse waves and the types of corrective waves occur at every scale and timeframe, as components of hierarchical fractals.
By distinguishing between impulse waves and corrective waves at several degrees of trend, a technical analyst can better tell apart price movements that go with the trend from price movements that go against the main trend, when making trading decisions.
Read also: Triangles in Elliott wave theory
Frequently Asked Questions
How many Elliott waves are there?
There are 5 Elliott waves, and they move impulsively: wave 1, wave 3 and wave 5 move toward the general trend, while wave 2 and wave 4 move in the opposite direction.
How do you draw Elliott waves?
They are drawn starting from the larger timeframe down to the smaller timeframe, because an Elliott wave is made up of a group of waves moving in different directions. A wave cycle consists of 8 waves, 4 of them in the general direction, and 3 of them in the direction opposite the general trend.
What do Elliott waves mean?
It is one of the tools of technical analysis, used to form an outlook on possible future market movement by reading a stock’s peaks and troughs and its lower and upper bounds.
What is wave analysis?
It is a technical approach used to estimate market movement, stock trends and a stock’s price changes, and wave analysis is one of the effective tools of technical analysis.
What is technical analysis of stocks?
It is reading a stock’s historical performance to try to estimate its future price direction, using programs, platforms and tools that specialize in technical analysis for the stock and forex markets, such as charts that link price and time.
Disclaimer: This article is for educational purposes only and does not constitute investment advice or a recommendation to buy or sell any financial instrument. Elliott Wave analysis is a subjective technical method and does not guarantee future price movement. Trading CFDs and leveraged products carries a high level of risk and can result in losses that exceed your deposited capital; most retail investor accounts lose money when trading CFDs. This page may contain affiliate links, meaning we may earn a commission if you sign up with a broker through one of our links, at no extra cost to you. Always do your own research and consider seeking independent financial advice before trading.