
False Breakout Strategy

The false breakout is a widely used price-action approach, because many newer traders get caught in false breaks of support and resistance zones. A false break works like a trap set by the market: price looks like it will break a support or resistance level, yet it may reverse right after that false break happens. Because of this, you need to recognise this kind of move and try to use it in your favour. As always, the experts at Easy Trade keep the educational material simple, and here we walk through the false breakout strategy in clear, easy steps.
What is a false breakout
A false breakout is a break that fails to continue beyond an attempt to breach a support or resistance level. It is the outcome every measured-move setup is exposed to, including the cup and handle, where entry is taken on the break of the rim.
More: Broken trend strategy explained
False breakout example
A false break is essentially a “conflicting” move in the market that flushes out the people who entered on emotion rather than logic and forward thinking.
Read also: Best scalping strategy 2026
Requirements for the false breakout strategy
All you need for this strategy is to know how to draw support and resistance lines, along with the timeframe you are using.
This strategy works on every timeframe, but it is more accurate on the higher timeframes, starting from the 4-hour.
Read also: How to avoid false breakouts on the chart
Rules of the false breakout strategy
Draw the support and resistance lines
Our first step is to draw the support and resistance lines. Support and resistance are important areas in technical analysis, where price shows noticeable activity nearby.
As mentioned above, there is noticeable price activity near these levels, so our first condition is for price to reach the resistance line and pass it by a few pips, but without closing above it, which means a false breakout has occurred.
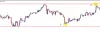
Wait for the false breakout to form
In the previous figure, the false break happened at point 2 only and not at point 1, because at point 1 price did not pass the support level. At point 2, price passed the resistance level and then closed below it.
Enter a sell trade after the first bearish candle closes below the support line
Don’t rush in and enter a trade as soon as the false-breakout candle appears, because that signal alone is not enough. You should wait for a candle to form after the break candle, and wait for that candle to close.
In the previous figure you’ll notice we waited for an engulfing candle to appear before executing a sell trade.
Set the stop-loss order

The stop-loss order will of course sit at the highest point price reached, which is the false-breakout candle that price reversed from.
Set the take-profit order
The take-profit order will be near the previous low, because price is likely to bounce near it. The next figure shows this.
Note* the above is an example for sell trades; you can apply the same rules but in the opposite direction when you take buy trades.
To get comfortable with the false breakout strategy, consider the following scenario:
Say you’ve had EUR/USD on your watchlist for weeks, and more specifically you were waiting for a break below the main support level to benefit from the selling that would follow. After three weeks of patience and discipline, you finally sold EUR/USD against the US dollar and it closed below the support level.
But once you are comfortable with the false breakout strategy, you’ll open your trading platform, enter the necessary trade details, place a limit order, and before you go to bed you’ll set the profit you expect to take.
The next morning you wake up to find that EUR/USD not only failed to respect the former support as new resistance, but also moved 200 pips against the US dollar, and the trade closed out.
According to the false breakout strategy, the pair will keep closing the day back above your main level, which cancels the whole trade idea along with your bearish bias.
Read also: The best day trading strategy, here are the top 10 strategies
Try this strategy on a demo account first
A strategy that looks clear in an article can behave very differently under real spreads and volatility. Testing it on a demo account shows you how it performs before you commit any capital.
Advertising disclosure: partner link. Easy Trade may receive compensation. Educational content, not financial advice. CFDs carry a high risk of losing your capital.
Frequently asked questions
What is the benefit of a trend?
Because it is one of the most common trading approaches, following the trend has many advantages, including lower transaction costs and the ability to ride moves.
How does a trend start?
A trend in forex, the stock market and so on is when the market moves up or down over a defined period of time. It shows whether buyers (an uptrend) or sellers (a downtrend) are in control. How do you identify trends? The best way to identify trends, from my experience, is to use simple price action.
What does breaking the trend mean?
The trend-break technique helps you identify when to enter a trending market. You can use the trend line to trail your stop-loss and ride strong moves. If the trend line breaks, wait for a retest and see whether it holds. If it does, the market is more likely to reverse in the opposite direction.
What is a false breakout?
False breakouts happen when price crosses a certain level (support, resistance, a triangle, a trend line and so on) but does not keep accelerating in that direction. Instead, what you may have seen was a short spike followed by price returning to its trading range.
Risk disclaimer
This article is for educational purposes only and is not investment advice or a recommendation to trade. Trading forex and CFDs uses leverage and carries a high risk of losing money quickly; you can lose more than your initial deposit, so never risk funds you cannot afford to lose. Chart patterns such as false breakouts can fail, and past behaviour does not guarantee future results. Some links on Easy Trade may be affiliate links, and we may earn a commission at no extra cost to you. Do your own research and consider your circumstances before trading.