
14 Candlestick Reversal Patterns

Japanese candlestick patterns are read to gauge the likely direction of price and to spot possible reversals in the market.
If you like trading with Japanese candlesticks without relying on indicators, candlestick patterns are worth learning, because they carry a lot of information and are easy to read straight off the chart.
Many traders judge the trend by reading Japanese candlesticks, which go by many names such as the evening star, the morning star, the shooting star, engulfing candles, the pin bar, and so on.
How to Use Japanese Candlesticks
A Japanese candlestick chart gives the trader useful information about price action at any moment, and it often helps confirm the signals traders already see, which improves how they weigh probabilities in a trade.
Trading price action from candlesticks alone is a very common technique, yet candlestick reading tends to be strongest when it is confirmed by extra indicators or paired with support and resistance zones.
Japanese candlestick patterns in forex are specific candle shapes on the chart that often precede certain moves; when they are recognised in time and traded correctly, they can help estimate the likely direction of the next price move.
Forex candlestick patterns fall into two types — continuation patterns and reversal patterns. Below we cover the most common reversal and continuation patterns and discuss what they can show.
Read also: Best types of Japanese candlesticks
Japanese Candlestick Patterns
The patterns below perform well on the chart across all time frames — intraday, weekly, or monthly.
In the examples that follow, a hollow white candle means the close was higher than the open, while a filled black candle means the close was lower than the open.
This is a detailed guide to Japanese candlestick patterns, so take your time with it and come back whenever you need a reminder.
Note: patterns that point to the trend continuing are called continuation patterns, and patterns that point to the trend reversing are called reversal patterns.
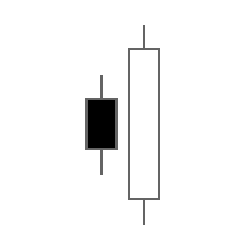
Bullish Engulfing
It forms from a first candle with a small black body sitting inside a second large white candle. When it appears, it is read as an upside reversal signal, and it is considered one of the stronger Japanese candlestick patterns.
Bearish Engulfing
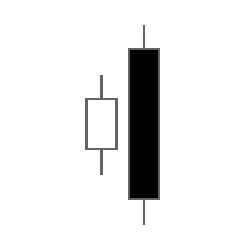
It forms from a first candle with a small white body sitting inside a second large black candle. When it appears, it is read as a downside reversal signal.
Dark Cloud Cover
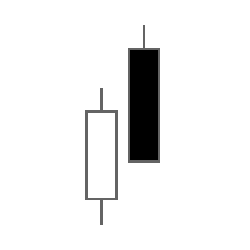
It forms from two candles: the first is a long white candle, and the second is a black candle that opens above the close of the first white candle and then closes inside its body. It is a bearish reversal signal within an uptrend, and it is one of the Japanese candlestick patterns.
Piercing Pattern
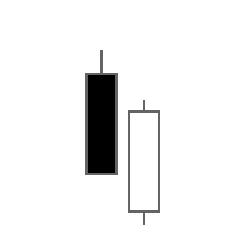
It forms from two candles: a black candle followed by a white candle that opens below the low of the black candle but climbs back to close above the midpoint of the black candle (above its 50% level). It is read as a reversal signal when it appears in a downtrend, and it is one of the Japanese candlestick patterns.
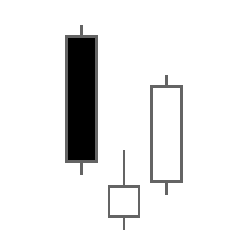
Morning Star
It forms from a large black candle, followed by a small candle (black or white) below it; on the next day a third white candle forms and closes inside the body of the first black candle. Its appearance is read as an upside reversal signal when it shows up in a downtrend.
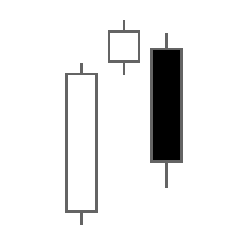
Evening Star
It forms from a large white candle, followed by a small candle (black or white) above it; on the next day a third black candle forms and closes inside the body of the first white candle. Its appearance is read as a downside reversal signal when it shows up in an uptrend.
Read also: The main types of Japanese candlesticks and how to read them
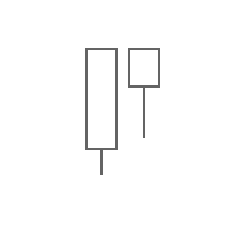
Tweezer Top
It forms from two or more candles and marks a resistance level the price cannot break through. The candles share the same upper shadow, while their sizes and colours can differ. It is a bearish reversal signal.
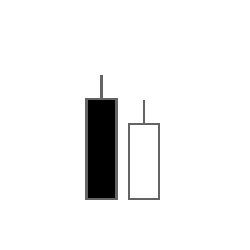
Tweezer Bottom
It forms from two or more candles and marks a support level the price cannot break through. The candles share the same lower shadow, while their sizes and colours can differ. It is a bullish reversal signal, and it is one of the Japanese candlestick patterns.

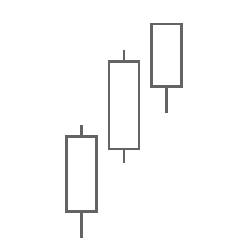
Three White Soldiers
It forms from three candles, each a long white candle with a successively higher close. When it appears in a downtrend, it is read as an upside reversal signal.
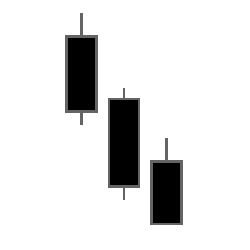
Three Black Crows
It forms from three candles, each a long black candle with a successively lower close. When it appears in an uptrend, it is read as a downside reversal signal, and it is one of the Japanese candlestick patterns.
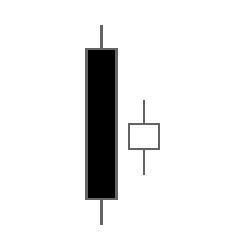
Bullish Harami
It forms from a first large black candle followed by a candle with a small white body (sitting inside the large black body). It appears in a downtrend and is read as an upside reversal signal.
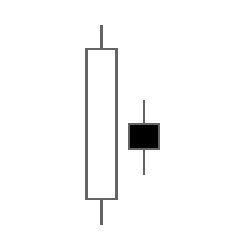
Bearish Harami
It forms from a first large white candle followed by a candle with a small black body (sitting inside the large white body). It appears in an uptrend and is read as a downside reversal signal, and it is one of the Japanese candlestick patterns.
Rising Window
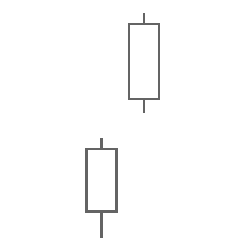
Two candles: a first white candle followed by a white candle that opens above the high of the first candle (a gap). It is read as an upside signal.
Falling Window
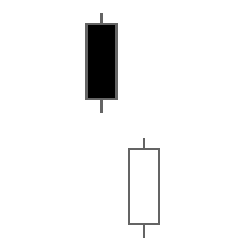
Two candles: a first black candle followed by a white candle that opens below the low of the first candle (a gap). It is read as a downside signal.
Read also: The best 9 patterns for mastering Japanese candlesticks
Japanese candlestick patterns are marked by the shadows, or wicks, above and below the real body. The shadows show the high and low prices traded that day, so a short upper shadow on the lower candle means the open that day was near the day’s high.
A short upper shadow on an up day also means the close was near the high. The relationship between the open, high, low, and close sets the shape of each daily candle: real bodies can be long or short, and shadows can be long or short.
Compared with a bar chart, bar charts and candlestick charts show the same information in different ways, but candlestick charts are clearer thanks to the colour coding of the price bars and the thick real bodies, which make the difference between the open and the close stand out.
Read more:
- Butterfly pattern | spotting the end of a trend move
- What are support and resistance levels?
Frequently Asked Questions
What does a doji candle indicate?
A doji candlestick reflects indecision between buyers and sellers, so a doji can be viewed as a possible signal for a trading opportunity. There are several types of doji candles that can appear on a candlestick chart.
What is the hanging man candle?
The hanging man represents heavy selling after the open that pushes the price down, but buyers then drive the price back up near the open. Traders read the hanging man as a sign that the bulls are starting to lose control and that the asset may soon enter a downtrend.
How many Japanese candlestick types are there?
There are three basic types of candlestick pattern: a bullish reversal candlestick pattern, a bearish reversal candlestick pattern, and a continuation candlestick pattern.
What does a candle indicate?
It gives a graphical representation of the supply and demand behind the price move for each time period. The closing price of the security being traded determines whether the candle is bullish or bearish. The real body is usually white when the candle closes above the open.
What are the types of Japanese candlesticks?
There are three basic types of candlestick pattern: a bullish reversal candlestick pattern, a bearish reversal candlestick pattern, and a continuation candlestick pattern.
Test this indicator without risking capital
Reading about an indicator is not the same as watching it behave on a live chart. A demo account lets you apply the settings above to real market data and see how the signals form before any money is involved.
Advertising disclosure: partner link. Easy Trade may receive compensation. Educational content, not financial advice. CFDs carry a high risk of losing your capital.