
Introduction to Elliott Wave Theory

Elliott Wave theory is named after Ralph Nelson Elliott (July 28, 1871 – January 15, 1948), an American accountant and author. Elliott concluded that stock market movement could be forecast by observing and identifying a recurring pattern of waves.
Ralph Nelson Elliott developed the Elliott Wave theory in the late 1920s. Elliott believed that stock markets, which are generally thought to behave in a fairly chaotic way, actually move in recurring cycles.
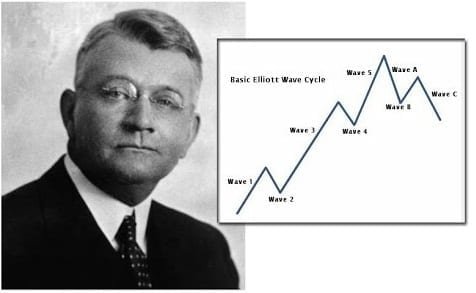
Elliott’s theory rests partly on Dow Theory’s premise that stock prices move in waves, and partly on patterns observed throughout nature. Elliott proposed that market cycles resulted from investors’ reactions to external influences, or the prevailing crowd psychology of the time, and found that the rises and falls of mass psychology always appeared in the same recurring patterns, which he then divided into patterns he described as “waves.”
Elliott Wave analysis allowed markets to be studied in more depth, identifying specific characteristics of wave patterns and making detailed, pattern-based market forecasts. Elliott partly based his work on Dow Theory, which also described price movement in terms of waves, but he refined the wave concept further.
Elliott first published his theory of market behavior in his book The Wave Principle in 1938, summarized it in a series of articles in Financial World magazine in 1939, and covered it more fully in his final major work, Nature’s Law: The Secret of the Universe, in 1946. Elliott stated that because human action follows a balanced process, activity related to it could be projected forward, though this could not yet be confirmed with certainty.
Elliott Wave theory is a form of technical analysis that helps traders analyze financial market cycles and anticipate market direction by identifying recurring patterns in investor psychology, price rises and falls, and other collective factors.
The Basic Principle of Elliott Wave Theory (1930s)
In simple terms, movement in the main trend consists of 5 waves (called the impulse wave), while any correction against the trend occurs in three waves (called the corrective wave). The waves moving with the trend are labeled 1, 2, 3, 4, and 5, and the three corrective waves are labeled A, B, and C. These patterns can be seen on long-term as well as short-term charts.
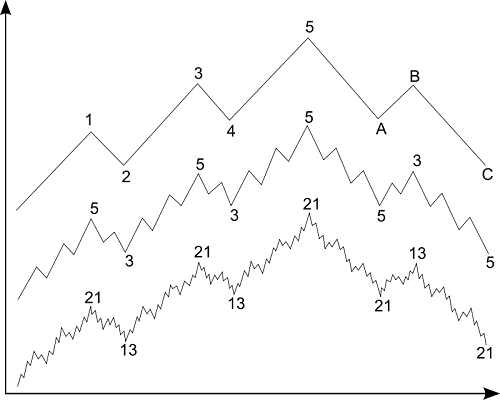
Ideally, smaller patterns can be identified within larger patterns, and in this sense Elliott Wave resembles a piece of broccoli, where a smaller piece looks similar once separated from the larger one. In practice, this information (about smaller patterns fitting into larger patterns), together with Fibonacci relationships between waves, gives a trader a level of anticipation when looking for trading opportunities.
Market Forecasts Based on Wave Patterns

Elliott put forward detailed forecasts for the stock market based on unique characteristics he found in wave patterns. The impulse wave, which moves with the main trend, always shows five waves in its pattern, and on a smaller scale, five waves can be found again within each impulse wave. In this smaller pattern, the same pattern repeats itself indefinitely, and these ever-smaller patterns are classified as different wave degrees within Elliott Wave theory.
Elliott Waves Today
The development of computer and internet technology is perhaps the development that most defines the twenty-first century, and the growth of computer-based trading has produced a new class of traders who trade purely on technicals, probabilities, and statistics, without the human emotional side. In addition, these systems trade at extremely high speed, executing buy and sell orders in seconds or even milliseconds through brokerage firms.
There’s no doubt that the trading environment we face today is quite different from that of the 1930s, when Elliott developed the Wave Principle. Legitimate questions arise about whether Elliott Wave can still be applied in today’s trading environment. After all, if it makes sense to expect today’s cars to differ from those of the 1930s, why assume that trading technique from 1930 can be applied to today’s trading environment?
The biggest change in today’s market compared with the 1930s lies in identifying the trend and the counter-trend. We now have four main market categories: stocks, forex, commodities, and bonds. Elliott Wave theory was originally derived from observing the stock market (i.e., Dow Theory), but some markets, such as forex, behave as a broader market.
In today’s market, 5-wave moves still occur, but years of observation suggest that 3-wave moves happen more often in the market than 5-wave moves. In addition, the market can keep moving in a corrective structure in the same direction — in other words, the market can trend in a corrective pattern, continuing in a 3-wave sequence, get a correction, and then continue the same trend again in a trending move. We therefore believe that in today’s market, trends do not have to unfold in 5 waves only, and that trends can unfold in 3 corrective waves. It is important not to force everything into a 5-wave trending count when trying to identify the trend and label the chart.
Elliott Wave theory, then, is a technical analysis theory used to describe price movements in financial markets. It was developed by Ralph Nelson Elliott after he observed recurring fractal wave patterns.
Elliott waves can be identified in the price movements of stocks, commodities, and currencies, and even in consumer behavior. Investors who try to profit from a market trend can be described as riding the wave in a large, powerful move. The key points of Elliott Wave theory can be summarized as follows:
- Elliott Wave theory is a form of technical analysis that looks for recurring, long-term price patterns tied to ongoing changes in investor sentiment and psychology.
- The theory identifies impulse waves that form a pattern, and corrective waves that move against the larger trend.
- Each set of Elliott waves nests inside a larger set of waves that follows the same impulsive or corrective pattern, an approach described as a fractal approach to investing.
Test this indicator without risking capital
Reading about an indicator is not the same as watching it behave on a live chart. A demo account lets you apply the settings above to real market data and see how the signals form before any money is involved.
Advertising disclosure: partner link. Easy Trade may receive compensation. Educational content, not financial advice. CFDs carry a high risk of losing your capital.
Disclaimer: This article is for educational purposes only and is not investment advice. Elliott Wave analysis is a subjective form of technical analysis; wave counts and forecasts can be read differently by different analysts and are not guaranteed to predict future price movement. Trading forex, CFDs, and other leveraged instruments carries a high level of risk and may not be suitable for every investor, and you can lose more than your initial deposit. This page may contain affiliate links, and Easy Trade Web may earn a commission if you open an account through them, at no extra cost to you.