
Pin Bar Candlestick Indicator

If you’re looking for a pin bar candle on your chart, you’re in the right place. The pin bar candle indicator detects this very strong candle type when it forms on your chart.
Many forex traders simply can’t tell a Doji candle apart from a pin bar candle, so the indicator makes it easier for forex traders to spot the difference between the two.
When you add the indicator to your chart, this is what you’ll see:
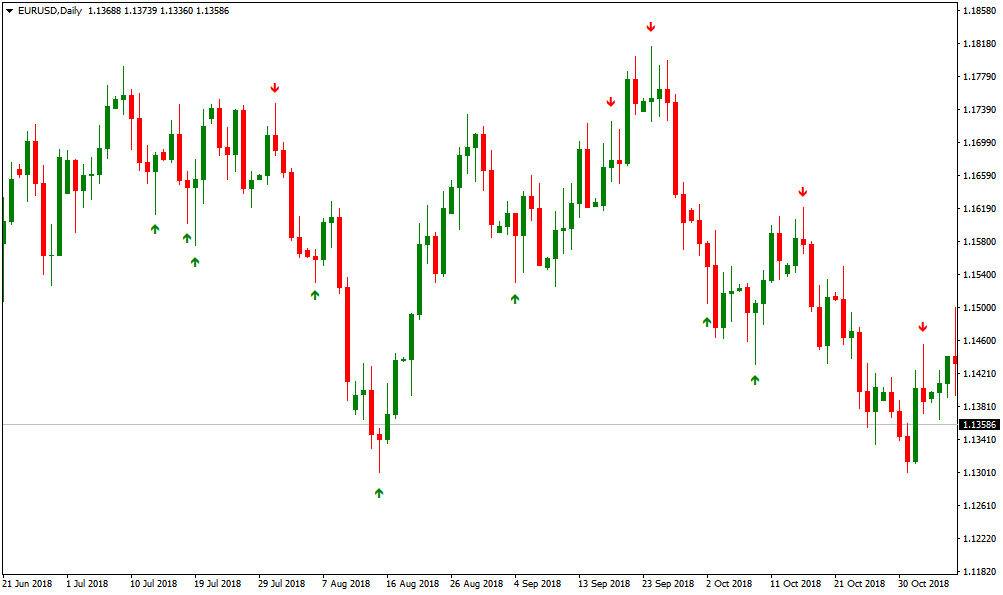
What the indicator plots is a red and green arrow, as shown on the chart, when a pin bar candle forms.
What Is a Pin Bar Candle and How Is It Used?
Pin bar candle: a candle with a long upper or lower shadow and a small body. It appears in both uptrends and downtrends, and there are two types of pin bar candles.
- Bullish reversal pin bar: forms at the end of a downtrend, with the candle’s shadow pointing downward.
- Bearish reversal pin bar: forms at the end of an uptrend, with the candle’s shadow pointing upward.
Here are a few rules you need to know about the pin bar candle:
- The pin bar candle has a very long tail, a small body, and a very short head — or none at all.
- If a pin bar candle forms in an uptrend, it may signal the start of a downtrend.
- If a pin bar candle forms in a downtrend, it may signal that an uptrend is about to begin.
- A pin bar candle can form on any timeframe, from 1 minute up to the monthly chart.
For more precise trading decisions, it’s best to use larger timeframes, such as 30 minutes and above, since their signals are considered more reliable than those on smaller timeframes.
The next question to answer is how a pin bar candle forms, or what causes this type of Japanese candlestick to appear.
To answer that, you need to understand that behind every pin bar candle that forms, there are always two forces at work: the bulls (buyers) and the bears (sellers).
If the candle is bearish, it tells you sellers were in control during the period it formed.
The opposite is also true — if the candle is bullish, buyers were the ones in control.
Advantages of Trading with the Pin Bar Candle
The pin bar pattern is made up of a single candle and usually represents a sharp reversal and price rejection. The pin bar candle, as it’s sometimes called, is marked by a long tail, which is also referred to as the “shadow” or “wick.” The area between the pin bar candle’s open and close is called the real body, and pin bar candles generally have small real bodies compared to their long tails.
The pin bar candle’s tail also shows the price area that was rejected, with the implication that price will keep moving in the direction opposite to where the tail points. So a bearish pin bar signal is one with a long upper tail, showing rejection of higher prices and suggesting price may fall in the near term. A bullish pin bar signal has a long lower tail, showing rejection of lower prices and suggesting price may rise in the near term.
When trading the pin bar candle, traders have a few different entry options. The first, and probably the most popular, is entering the pin bar trade once it has finished forming on the chart — which simply means entering the trade at the current market price.
Another entry option for a pin bar signal trade is entering on a 50% retracement of the pin bar candle. In other words, you wait for price to pull back to roughly the midpoint of the pin bar candle’s full range, from high to low — the 50% level — where you would already have placed a specific entry order.
So one of the biggest advantages of trading the pin bar candle is that it shows a quick shift, or a change, in market sentiment.

It actually lets you see whether the bulls or the bears have the upper hand.
Trading the pin bar candle on its own isn’t enough — combine it with another technical analysis tool, such as support and resistance or wave analysis, among others.
What Are the Best Areas to Trade?
Candlestick pattern traders can trade the pin bar candle in the direction of the reversal, since a bearish pin bar has a long tail on the upper side of the candle, showing that buyers rejected the price.
On the other hand, a bullish pin bar has a long tail at the bottom of the candle, pointing to rejection of the sellers’ price, and traders can place their stop-loss at the candle’s high for sell orders and at the candle’s low for buy orders.
The pin bar candle indicator plots simple arrows and points the forex trader to where a pin bar candle has formed. It’s also useful for new forex traders who are just starting to learn candlestick patterns, and new forex traders can use the indicator as a detector to quickly locate a pin bar candle.
On the other hand, experienced traders can use the pin bar candle by combining it with technical chart patterns and candlestick patterns to build trading plans.
In my opinion, if the candle forms at an important level, such as support and resistance or Fibonacci levels, that’s when I’d consider trading it, because these are confluence points — areas where traders often see setups as higher quality. As always, no setup is guaranteed to work, and outcomes vary.
Frequently Asked Questions
How Many Japanese Candlestick Patterns Are There?
The market can only form one out of eight basic candles during any given period. Interpretations may vary across different markets, but the basics stay the same — there are no other possibilities. Once you understand these eight candles, you can apply them to whatever market you trade.
What Is a Reversal Candle?
A reversal candle pattern is a Japanese candlestick formation arranged in a way that points to the end of an existing trend in favor of the opposite direction.
What Is the Pin Bar Candle?
The pin bar, or pin candle, is a Japanese candlestick with a long wick on one side and a small body. Japanese candlesticks were created by a Japanese rice trader named Munehisa Homma in the 17th century. Homma believed human psychology drives the market, and he wanted to represent that visually, which is how he invented Japanese candlesticks.
What Do Japanese Candlesticks Mean?
A Japanese candlestick is a type of price chart that shows the open, close, high, and low for a given time period. It was invented by Japanese rice traders centuries ago and was popularized among Western traders by a broker named Steve Nison in the 1990s.
Test this indicator without risking capital
Reading about an indicator is not the same as watching it behave on a live chart. A demo account lets you apply the settings above to real market data and see how the signals form before any money is involved.
Advertising disclosure: partner link. Easy Trade may receive compensation. Educational content, not financial advice. CFDs carry a high risk of losing your capital.
Disclaimer
This article is for educational purposes only and does not constitute investment or trading advice. Trading CFDs and other leveraged products carries a high level of risk and may not be suitable for all investors — you can lose more than your initial deposit. Some links on this page may be affiliate links, which means we may earn a commission if you sign up through them, at no extra cost to you.