
Parabolic Sar Moving Average Strategy

The Parabolic SAR and moving average strategy is a trend-following approach that combines two directional indicators into a single setup. It is used to read the current trend and to spot possible reversals, though like any technical method its signals can fail. Below we merge the Parabolic SAR with two moving averages into one workflow.
Indicators you need
As the name suggests, this strategy uses only the Parabolic SAR and the moving average:
- Parabolic SAR with its default settings
- A 20-period moving average
- A 40-period moving average
Time frame for the Parabolic SAR and moving average strategy
This strategy suits scalping and short-term trades, so you can use it on time frames from the 1-minute up to the 1-hour chart.
Rules of the Parabolic SAR and moving average strategy
After adding the required indicators as shown below:
We will apply the rules with an explanation in simple steps.
1- Identify the direction of price movement
This strategy is not suitable in sideways moves. Look at the following chart:
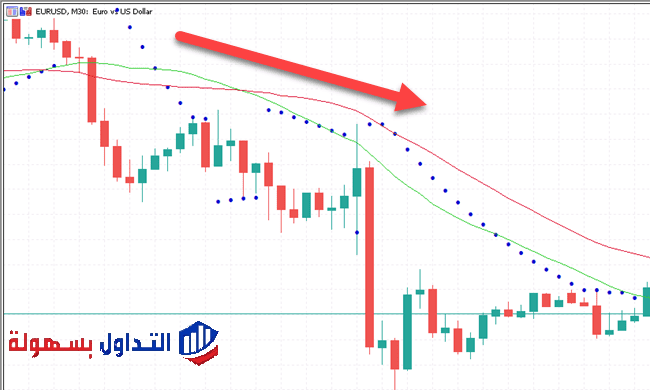
In the chart above the price was moving in a downtrend. If the direction is sideways, the Parabolic SAR reading becomes scattered and hard to read.
2- Wait for a change in the Parabolic SAR
One use of the Parabolic SAR is to identify the direction of price movement. When the indicator prints above the candles, that points to a downtrend; when it prints below the candles, that points to an uptrend. In the previous chart the reading was above the candles, indicating a downtrend, then it shifted below, which means there is either a correction or a possible change in direction.
In this strategy we wait for the price to return to its original direction, meaning we wait for the indicator reading to reappear in the direction of price movement, as shown:

3- Confirm the 20 moving average is above the 40 moving average
Moving averages are also a useful tool for identifying the trend. To add confirmation for a higher-quality setup, check that the 20 moving average (red) is above the 40 moving average (green).
4- Enter a sell trade at the open of the candle after the Parabolic SAR signal
Enter a sell trade on the first candle that follows the Parabolic SAR signal, as shown.
5- Set the stop-loss order
Place the stop-loss at the highest point on the Parabolic SAR, as shown.
Notice in the chart above that the price resumed its direction before reaching the stop-loss area.
6- Set the take-profit order
In this strategy, the take-profit is set when any signal indicating a change in direction appears from the Parabolic SAR and the moving average, as shown.
Note: the example above shows the strategy in a downtrend. You can apply the same rules in the opposite direction when using the strategy in an uptrend.
The Parabolic SAR and the moving average are among the more common trend-following indicators. Their appeal is that they help identify not only the direction but also when the trend may reverse, which is the point of combining them in this strategy.
The Parabolic SAR dots stop and reverse when the trend turns lower, and vice versa; the dots sit below price when the move is up and above price when the move is down. The Parabolic SAR is prone to false signals in ranging markets, so here the moving average acts as a filter for the signal.
Try this strategy on a demo account first
A strategy that looks clear in an article can behave very differently under real spreads and volatility. Testing it on a demo account shows you how it performs before you commit any capital.
Advertising disclosure: partner link. Easy Trade may receive compensation. Educational content, not financial advice. CFDs carry a high risk of losing your capital.