
Fibonacci Tool With Trendline

The trend line and the Fibonacci tool are among the best-known and most widely used technical analysis tools. I won’t be exaggerating if I say the first thing you learn on your journey into forex trading is how to draw a trend line. You may also want to read about Reversal Zone Trading Strategy.
That’s because it is one of the foundations of technical analysis. You may also have heard of, or already use, the Fibonacci tool and know how useful and effective it is in the trading markets. We’ll bring these two tools together, and this article focuses on how to use Fibonacci with the trend line.
Defining the Fibonacci Tool and Trend Lines
- Trend line: a technical analysis tool used to identify the market’s current direction — whether it is moving up or down.
- Fibonacci sequence: a numbering system discovered by the Italian mathematician Leonardo Fibonacci. It produced a set of ratios known as the Fibonacci sequence, and these levels are 0%, 23.6%, 38.2%, 50%, 61.8%, 78.6% and 100%. Beyond its uses in the trading markets, Fibonacci appears in many areas of nature, which is why these are called the golden Fibonacci ratios.
Why Combine Trend Lines and Fibonacci Ratios?
As mentioned above, the trend line is one of the stronger technical analysis tools for identifying the general direction of the market, and Fibonacci ratios are used to estimate where corrective and directional moves may end. Combining the two is a common approach traders use to look for entries — keep in mind that no method guarantees a profit, and any signal can fail.
How to Draw a Trend Line
When drawing a trend line, keep the following in mind:
- The trend line should rest on three peaks in a downtrend or three troughs in an uptrend. (It can rest on just two peaks or two troughs, but if it also touches a third peak or trough it will be more reliable.)
- Draw the trend line along the candle bodies, not the candle wicks.

The chart above shows a downward trend line. Notice that the trend line rests on more than four points and is drawn along the candle bodies, not the candle wicks.
How to Draw a Fibonacci Retracement on the Chart
MetaTrader has five Fibonacci tools: Fibonacci Retracement, Fibonacci Time Zones, Fibonacci Fan, Fibonacci Arcs and Fibonacci Expansion.
What matters in this article is the Fibonacci Retracement. You’ll find it in the tools menu on the MetaTrader platform, as shown in the images.

- After clicking it with the mouse, look for the last down wave in an uptrend, or the last up wave in a downtrend.
- Then click and drag downward if you want to find where an upward correction ends, or drag upward if you want to find where a downward correction ends. See the following figure:

In the figure above the correction was downward. We drew the Fibonacci retracement on the last up wave, and the price bounced at the 50 Fibonacci level.
Read also: The 5 most popular uses of Fibonacci ratios in trading.
How to Use Fibonacci Levels With the Trend Line
After drawing the trend line and the Fibonacci retracement correctly, as explained above, identify any level where the trend line crosses a Fibonacci level. Then wait for the price to reach that level. Don’t rush in and enter a trade the moment the price arrives — wait for a Japanese candlestick that signals a change in direction, such as an engulfing candle. To put this on your own numbers, calculate the levels from a high and a low.
The rules for using Fibonacci with the trend line can be summarized as follows:
- First, draw a trend line based on three points.
- Draw the Fibonacci retracement on the last up wave when a correction occurs in a downtrend, or on the last down wave when a correction occurs in an uptrend.
- Mark the level where the Fibonacci level and the trend line cross.
- Wait for the price to reach that level.
- Don’t rush in and enter a trade the moment the price reaches this level — wait for a confirming candle that signals a change in direction.
See the following figure:
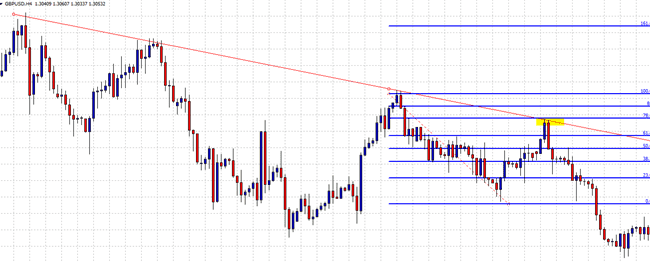
In the figure above the trend was falling. We first drew a trend line based on three points, then drew the Fibonacci retracement on the last down wave, and identified the level where the trend line crossed — the 78 Fibonacci level (in yellow). We then waited for a confirming candle, an engulfing candle appeared, and you’ll notice the price continued lower.

Another Example of Using Fibonacci With the Trend Line
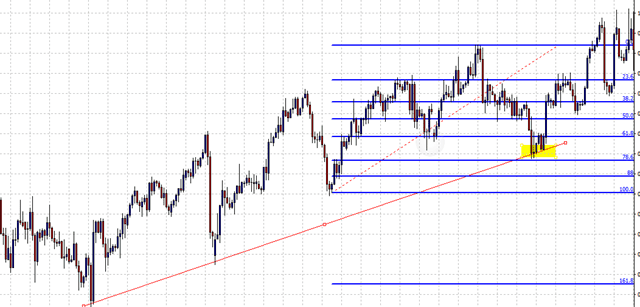
In the previous example, notice that we drew the trend line on just two points. It can rest on only two points, but with three or more it becomes more reliable. We then drew the Fibonacci retracement on the last wave and identified the level where the trend line crossed a Fibonacci level, at the 78 Fibonacci level. You’ll notice the price resumed its upward direction as soon as it reached the level we marked (in yellow).
Note: sometimes the price breaks the trend line and keeps going, so it’s important to wait for a confirming candle and not rush into any trades. When the price breaks the trend line and the level you marked, don’t go looking for another Fibonacci level to sell near — look for a different opportunity instead.
Finally, remember that the market doesn’t stay in one pattern; it evolves over time, so you should keep developing your own skills and look, from time to time, for varied methods and approaches to trading forex so you can keep up with this change.
Conclusion
As we saw above, the Fibonacci retracement tool is useful even if you plan to enter on a retest of the trend line.
Combining a diagonal support or resistance level with a horizontal one can mean that other traders are watching those levels too. And note that, as with other drawing tools, plotting trend lines together with Fibonacci levels can become subjective.
So if you see an uptrend developing, you should look for ways to buy to give yourself a better chance of a profitable trade — here you can use the Fibonacci retracement tool to help you find strong entry points. In short:
- Trend line: a technical analysis tool used to identify the market’s current direction — whether it is moving up or down.
- Fibonacci sequence: a numbering system discovered by the Italian mathematician Leonardo Fibonacci. It produced a set of ratios known as the Fibonacci sequence, and these levels are 0%, 23.6%, 38.2%, 50%, 61.8%, 78.6% and 100%. Beyond its uses in the trading markets, Fibonacci appears in many areas of nature, which is why these are called the golden Fibonacci ratios.
- The trend line should rest on three peaks in a downtrend or three troughs in an uptrend. (It can rest on just two peaks or two troughs, but touching a third makes it more reliable.)
The rules for using Fibonacci with the trend line can be summarized as follows:
- Draw a trend line based on three points.
- Draw the Fibonacci retracement on the last up wave when a correction occurs in a downtrend, or on the last down wave when a correction occurs in an uptrend.
- Mark the level where the Fibonacci level and the trend line cross.
- Wait for the price to reach that level.
- Don’t rush in the moment the price reaches this level — wait for a confirming candle that signals a change in direction.
Try this strategy on a demo account first
A strategy that looks clear in an article can behave very differently under real spreads and volatility. Testing it on a demo account shows you how it performs before you commit any capital.
Advertising disclosure: partner link. Easy Trade may receive compensation. Educational content, not financial advice. CFDs carry a high risk of losing your capital.
Frequently Asked Questions
How did Fibonacci discover the sequence?
Fibonacci discovered the Fibonacci sequence mainly through his travels in the Middle East and India. While talking with traders and other mathematicians, he was able to find that Indian culture had developed a numeric sequence system referred to as the Hindu-Arabic numeral system.
How do you draw Fibonacci lines?
Start at the swing high, then drag the cursor down to the swing low. Once you’ve set these two points, your Fibonacci retracement tool will place the ratios on the chart.
What is the Fibonacci tool?
The Fibonacci retracement tool draws percentage retracement lines based on the mathematical relationship within the Fibonacci sequence. The retracement levels provide support and resistance levels that can be used to target price objectives.
Is the Fibonacci sequence arithmetic?
The difference between any two consecutive numbers is not constant in the Fibonacci sequence. So the Fibonacci sequence is not an arithmetic sequence.
How do you use Fibonacci in trading?
Fibonacci retracements are often used as part of a trend-trading strategy. In this scenario, traders watch for a correction within a trend and try to make low-risk entries in the direction of the initial trend using Fibonacci levels.