
Golden Cross Trading Strategy

Many traders look up the golden cross strategy even though they may have already used it in earlier trades. As you will see in this article, the golden cross is not unusual at all, and it is one of the best-known trading strategies. Related reading: 1-Minute Forex Scalping Strategy.
What is the golden cross?
The golden cross is the crossover that happens between a fast moving average and a slow moving average. Here is an example.
When the fast 50 moving average crosses the slow 200 moving average, we call that crossover a golden cross.
Now we get to the subject of the article, which is how the golden cross strategy works. First, we will go over what the strategy needs.
What the strategy needs
As mentioned above, the golden cross happens between two types of moving averages, fast and slow. You can use any settings for these averages. Here we will use:
- The 200 moving average
- The 50 moving average
These indicators are strong on their own, but we need another type of indicator in this strategy to pin down the best entry points. In this walkthrough we will use the stochastic indicator.
Timeframe used in the golden cross strategy
You can use this strategy on any of the different timeframes, but the moving-average settings have to match the timeframe. The settings mentioned above suit mid-range timeframes such as the 30-minute and 1-hour charts, so this walkthrough uses the 30-minute timeframe.
Steps to apply the strategy
We will split the rules of the golden cross strategy into steps so they are easier to follow.
1- Set up the chart
First, we set up the chart by adding the indicators mentioned above, as shown below.
2- Wait for the golden cross to form
After adding the tools and indicators this strategy needs, what we wait for now is the golden cross described above, where the fast moving average cuts through the slow moving average. Look at the chart below.

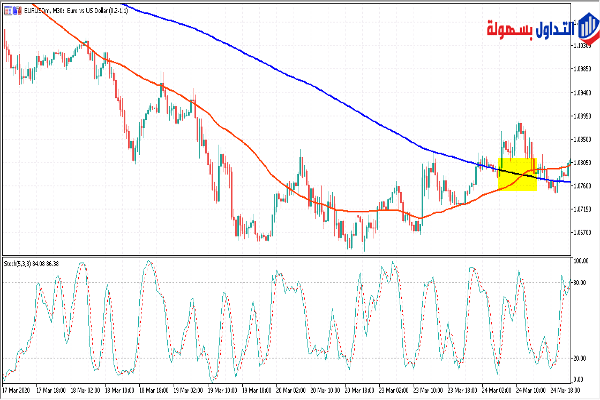
As you can see in the chart above, price was in a downtrend, but a golden cross formed, marked in yellow, which suggested a possible shift from a downtrend to an uptrend.
3- Buy on the stochastic signal
You cannot enter a buy trade the moment a golden cross appears. As you can see above, a pullback happened after the cross, and price could have turned back down, which we want to avoid as much as possible. So we wait for a signal from the stochastic indicator. Look at the chart below.
In the chart above you will see that price did not rise the moment the cross happened; instead a pullback occurred and price could have dropped again. To avoid that, we waited for a signal from the stochastic indicator and bought after it reached an oversold reading.
4- Set the take-profit and stop-loss
For the take-profit, we do not exit the trade until the reason for entering is gone, which is a crossover between the moving averages, but this time to the downside. Look at the chart below.
As you can see in the chart above, we exited the trade the moment the two moving averages crossed to the downside, after the example trade had gained more than 200 pips.
The stop-loss would sit at the last swing low that price formed, and it is important to protect the trade once price breaks the high it had formed earlier, as shown in the golden cross chart below.
Using the golden cross strategy to make trading decisions sits at the heart of technical analysis. Technical analysts work with a lot of data, often in the form of charts, to study stocks and markets. Sometimes the moving averages on these charts bend and cross in decisive, strong ways.
Technical traders learn to spot these common crossovers, such as the golden cross, and what they may signal about the future performance of a stock or market.
The golden cross points to a long-term uptrend moving higher, while the death cross points to the opposite, a long-term downtrend market. Both are read as strong confirmation of a long-term direction through a short-term moving average crossing a major long-term moving average.
Key points of the golden cross strategy
- The golden cross strategy points to a future long-term uptrend, while the death cross points to a long-term downtrend.
- Either crossover is seen as more important when it comes with high trading volume.
- Once the cross forms in the golden cross strategy, the long-term moving average is treated as a key support level on the way up, or a resistance level in the case of a death cross and a market falling from that point onward.
- Either crossover can appear as a signal of a change in direction, but more often it acts as strong confirmation of a change that has already happened.
Try this strategy on a demo account first
A strategy that looks clear in an article can behave very differently under real spreads and volatility. Testing it on a demo account shows you how it performs before you commit any capital.
Advertising disclosure: partner link. Easy Trade may receive compensation. Educational content, not financial advice. CFDs carry a high risk of losing your capital.
Risk disclaimer
This article is for educational purposes only and is not investment advice. The golden cross, moving averages, and the stochastic indicator describe what price has done and can give false or delayed signals; no strategy predicts the market or guarantees a profit. Trading forex and CFDs uses leverage and carries a high risk of losing money quickly. Only trade with money you can afford to lose, and consider seeking advice from a licensed financial adviser. This site may earn a commission from broker links at no extra cost to you.