
SMA vs EMA: Key Differences

The difference between SMA and EMA comes down to how sensitive each one is to changes in the data used in its calculation: the EMA puts heavy weight on recent prices, while the SMA applies equal weighting to every value, and both are among the more commonly used moving averages for stocks.
What Is the Difference Between SMA and EMA?
As always, it helps to be familiar with both indicators, and only time will tell whether the EMA or the SMA plays an important role in your trading strategy.
With that said, let’s look at when you should use the simple moving average and when you should use the exponential moving average.
Read also: What Is the Moving Average Indicator?
When Should You Use the Simple Moving Average (SMA)
Simple moving averages have been around for a long time, but the reason they’re still holding up and remain relevant is their versatility.
Forex traders use the SMA to spot reversals and trends, gauge the strength of an asset’s momentum, and identify potential areas where price may find resistance or support, based on how the moving average is calculated.
The SMA works well on longer timeframes, since it’s smoother and slower, which gives traders a sense of the overall trend.
The downside is that it can lag for a while, so you might miss a good entry price or miss the trade altogether.
The SMA isn’t the most sophisticated technical indicator out there, but it can still add value as part of a trading strategy, and it’s definitely worth testing.
Read also: Learn the 5- and 10-Day Simple Moving Average Strategy
When to Use the Exponential Moving Average (EMA)
The EMA is generally considered more suitable for short-term trading.
So if you want a moving average that reacts to price movement quickly, a short-period moving average is the way to go.
The EMA can also help you spot trends very early, which means there is more of a move potentially left to trade if the trend continues.
In fact, the earlier you catch a trend, the longer you can potentially stay in it, though how it plays out from there depends on market conditions.
The downside of using the EMA is that it reacts very quickly to price, so you might think a trend is forming when it could actually be a false signal during a consolidation period instead (careful there), which is why it matters to know the better EMA settings for what you’re trading.
This is a case of the indicator being almost too fast for its own good.
Read also: Exponential Moving Average Crossover Strategy
SMA vs EMA on a Forex Chart
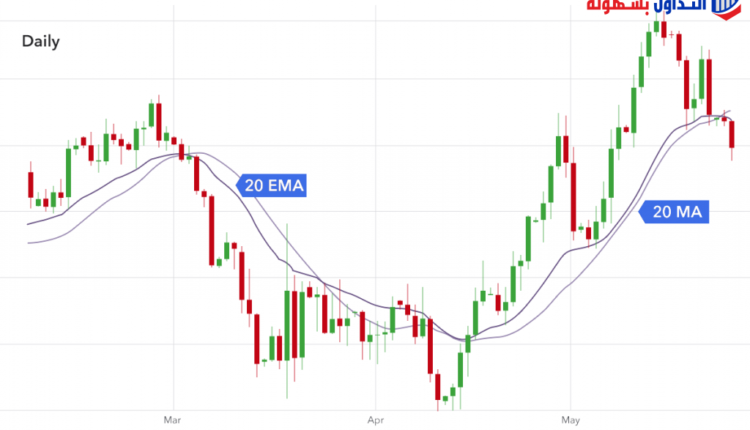
Let’s look at how the 20-period SMA compares with the 20-period EMA on the daily GBP/USD chart.
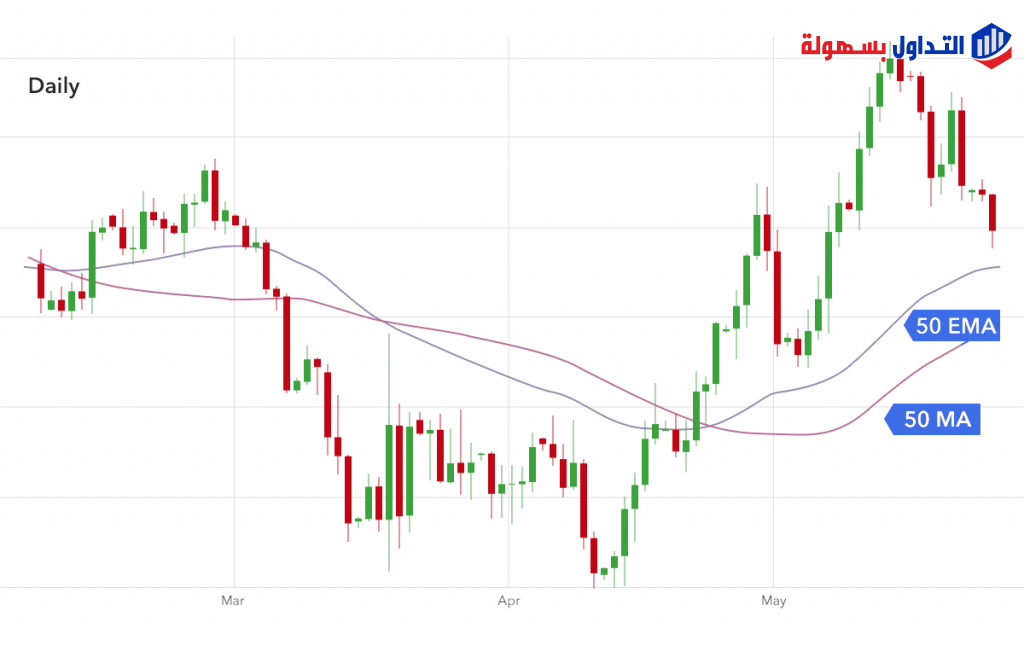
As a forex trader, you probably like charts, so here’s another one for you. This time we’ll compare the 50-period moving average — also known as the 50-day SMA strategy — with the 50-period EMA; by the way, some traders consider these particular settings among the better EMA settings.
Which Moving Average Is Better for Trading? SMA vs EMA
In the end, it comes down to personal preference, and there’s certainly no harm in plotting both on a chart to see how they compare.

The SMA and the EMA each have their own strengths and can be applied successfully in different situations.
Pull up a chart and start experimenting with some moving averages.
Try different types and test different periods; over time, you’ll find the moving averages that suit you best.
The SMA and EMA are similar in that both measure trends, both are read the same way, and both are commonly used by technical traders to smooth out the effect of price fluctuations.
But there are some differences between them: the core difference between the exponential moving average (EMA) and the simple moving average (SMA) is the sensitivity each one shows to changes in the data used in its calculation.
The SMA averages price data, while the EMA gives more weight to current data; more recent price data affects the EMA more heavily, with less influence from older prices, while the SMA assigns equal weighting to every value.
Read also: What Is Short-Term and Medium-Term Trading?
Test this indicator without risking capital
Reading about an indicator is not the same as watching it behave on a live chart. A demo account lets you apply the settings above to real market data and see how the signals form before any money is involved.
Advertising disclosure: partner link. Easy Trade may receive compensation. Educational content, not financial advice. CFDs carry a high risk of losing your capital.
Frequently Asked Questions About SMA vs EMA
What’s the difference between EMA and SMA?
The EMA gives more weight to recent prices than the SMA does. The SMA, on the other hand, focuses on giving every value equal weighting. See also our guide to MACD Indicator.
What are moving averages in stocks?
It’s the average price of a stock over a given period. It’s usually calculated from the opening and closing price, though it can also be calculated from the stock’s high and low, but the first method is preferred.
How do you adjust a stock’s price?
There are two ways to calculate an adjustment in stocks, but the most common one follows a set method: multiply the number of shares from the first purchase by the price of the first purchase, then multiply the number of shares from the second purchase by the price of the second purchase, then multiply the number of shares from the third purchase by the price of the third purchase. Add the resulting figures together, then divide the total by (the number of shares from the first purchase + the number of shares from the second purchase + the number of shares from the third purchase) × the result × 100 ÷ 100.
How is a stock’s price calculated?
There are several methods used to work out a stock’s price in the markets, including book value, intrinsic value, and market value. Ultimately, a stock’s price is set by supply and demand conditions over a given period.
What is an average price?
It’s the price level companies base their product sales on in the market. The average price depends on the type of product and its shelf life.
What are averages?
An average is the value a group’s figures cluster around, and it’s used to judge the rest of the values in that group.
What is the SMA indicator?
It’s the Simple Moving Average, a technical analysis tool traders use to identify market direction and a stock’s price fluctuations by focusing on the average price of a financial asset over a set period.
What is the WMA indicator?
It’s the Simple Moving Average, a technical tool used to identify potential market trends by giving more weight to recent changes and recent prices.
Disclaimer: This article is for educational purposes only and does not constitute investment advice. Trading forex and CFDs involves significant risk, including losses that can exceed your deposit due to leverage, and no indicator or strategy guarantees results. Some links on this page may be affiliate links, meaning we may earn a commission if you open an account through them, at no extra cost to you.