
What Is Time Analysis Forex

Traders in the financial markets use different tools and methods, all aimed at one goal: understanding how and why price moves, and why prices rise and fall. Explaining the reason behind moves is the job of fundamental analysis. How those moves appear on the chart, and how tops and bottoms form, is the job of technical analysis. But the more interesting question in trading is when those moves happen, that is, at what time price is likely to rise or fall. That is the job of time analysis in the forex market. To a degree this is possible: time analysis is used to estimate when moves may occur, and that is what we explain in this article. You may also want to read about Gann Price-Time Angles.
What is time analysis in the forex market?
Time analysis in the forex market is a trading approach used to estimate when price moves may happen. The first person to describe this type of analysis was the legendary trader William Delbert Gann (W.D. Gann), considered one of the best-known analysts of the twentieth century.
This approach is used to estimate suitable timing for possible up or down moves. Gann built his method of time analysis on squaring price and time, which means that when the duration of a move is squared with the range of the current move, a change in the direction of price becomes likely. Before relying on an estimate alone, derive the price levels from a square root.
Advantages of using time analysis in the forex market
- You do not need any forex indicators to make a trading decision. All you need is the price chart, so you can run any analysis quickly and easily.
- It gives strong, useful trading signals. Of course, no trading method or approach can be said to have a 100% success rate, but supporters say time analysis can give clearer signals than some other methods.
- Time-analysis tools are available on all trading platforms, including the MetaTrader platform, so you do not need to download any indicators or buy any trading software.
- Time analysis can be applied to all timeframes, from the one-minute up to the monthly.
In short, what we really need in our trades are clear signals that point to turning points on the chart, and time analysis in the forex market may be one of the few approaches that can identify those points for you.
Time cycles
Gann said that, in general, cycles govern every aspect of life. For example, the weather passes through four different seasons: winter, spring, summer and autumn. There are cycles in the economy, in nature and in the financial markets. In national economies there is slowdown, decline and recovery, and the same is true of price movement, where price passes through time cycles.
Time cycles are used to anticipate turning points in the direction of price, because they measure the time factor together with price movement, not price movement alone.
Look at the following figure:
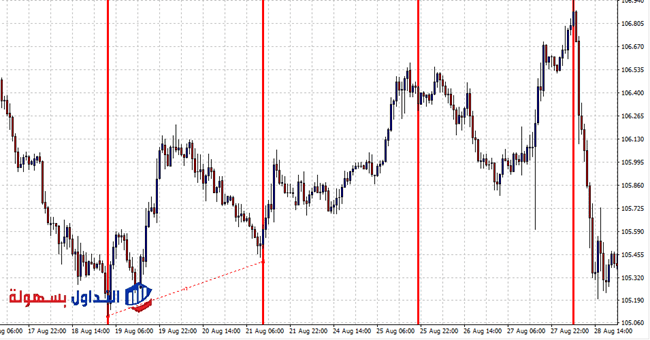
The previous figure shows three time cycles drawn on the chart of the US dollar against the Japanese yen. Notice that the direction of price changed between one cycle and the next.
Price angles
Another concept linked to time analysis in the forex market is price angles, also called time angles.
What are price angles?
They are called Gann angles, after their creator William Delbert Gann (W.D. Gann). They are a method for studying price movements through the relationship of geometric angles on charts that plot time and price. Gann’s theory studies price movements with the help of a series of angles drawn at different price points.
The square of nine
Gann’s square is the cornerstone of Gann price angles. From it you can derive the price angles, and it can also be used to estimate reversal prices.
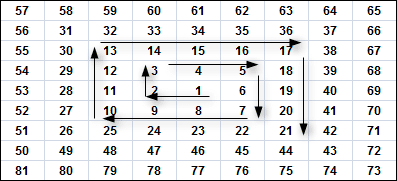
Read also: Time Analysis | What is the Square of Nine? A detailed explanation
How the Gann square is built
It is called the square of nine because the smallest complete square is the number nine, as shown in the previous figure. In the square of nine, price and time are squared. The square of nine starts with the number 1, which represents the center, then the numbers form a spiral around it, increasing as you move clockwise.
Each cell built from the number nine represents a vibration point for price movement (meaning there is a possibility of a reversal near those numbers).
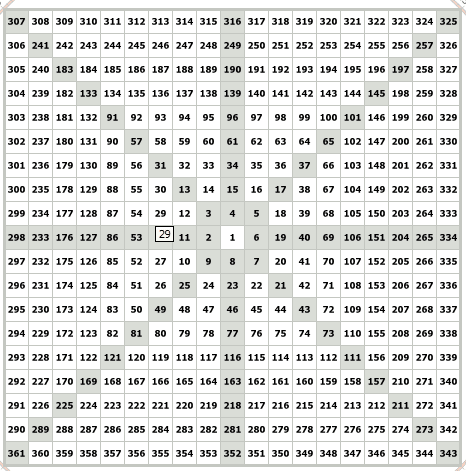
The numbers inside the Gann square also follow a harmonic pattern. For example, when you take a number such as 54 from the square above, the value next to it (to the right), 29, is derived as follows:
Take the square root of the number, subtract 2, then square again.
Example: 54 is the original number.
The square root of 54 = 7.348469
7.348469 – 2 = 5.438469
(5.438469)² = 29, rounded.
To find the value to the left, instead of subtracting 2 you add it: simply add +2 to the square root of 54 (7.348469), which gives 9.348469, then square this result to get the value 87.
Time-analysis tools on the MetaTrader platform

Today, time analysis can be applied very easily through trading software. Among the best-known tools used for this are:
- Gann Grid
- Gann Fan
- Fibonacci Time Zones
Gann Grid
The Gann Grid is one of the technical-analysis tools based on the concepts of William Delbert Gann (W.D. Gann). The tool is available on the trading platform.
MetaTrader: in the Gann Grid, time and price are squared based on the 45-degree angle, or the 1:1 relationship. The Gann Grid is a crossing series of Gann lines placed over the chart.
The 45-degree angle is very important in this grid, representing a 1:1 relationship between time and price. When price trades above the 45-degree line, it points to an uptrend; when price trades below the 45-degree line, it points to a downtrend.
Look at the following figure:
In the figure you will notice that price was moving between two lines at a 45-degree slope, which indicates a downtrend.
Gann Fan
The Gann Fan is one of Gann’s tools available on the MetaTrader platform. This tool is based on applications of Gann price angles. The idea behind the Gann Fan is to use it after a top or bottom has formed, to work out the angle of the new move, along with important support and resistance levels. The line in the middle is the 1×1 line, which represents a 45-degree slope, and there is a set of lines on either side of the middle line.
The first line is 1×2, the second is 1×4, and so on, and they provide support and resistance levels, as in the following figure:
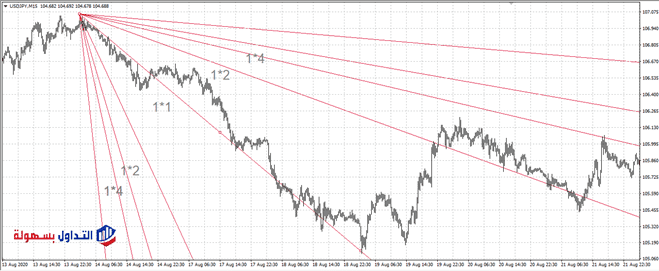
As you can see in the chart above, as time passes the lines move further apart, meaning the angle between them becomes larger and larger. This means the support and resistance level becomes harder to break through.
Fibonacci Time Zones
One of the concepts linked to time analysis in the forex market is Fibonacci time zones, whose strength most traders often overlook. It is one of the technical-analysis tools that many traders misunderstand.
Fibonacci time zones are shown as vertical lines on the chart in order to anticipate the time-extension areas of price movement, unlike Fibonacci retracement zones, which are drawn as horizontal lines that point to possible support and resistance levels. Look at the following figure:
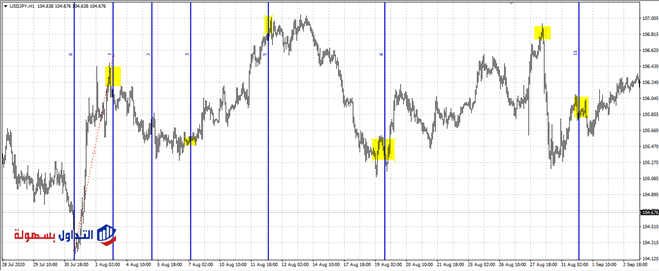
You will notice that price tended to change direction near the vertical lines that mark the Fibonacci zones.
You can use Fibonacci time zones on their own, but it is better to use them alongside historical support and resistance levels on the chart, then draw the Fibonacci time zones to identify possible reversal points. You should not expect price to change course exactly where the lines form; as you can see, the reversal only happened near them some of the time.
Conclusion
- Time analysis in the forex market is a trading approach used to estimate when price moves may happen. The first to describe this type of analysis was the legendary trader William Delbert Gann (W.D. Gann), regarded as one of the best-known analysts of the twentieth century.
- One advantage of time analysis is that you do not need many technical indicators, and it can analyze all timeframes. Supporters also consider its signals effective compared with other methods, and note that it is one of the few approaches meant to indicate when price may reverse.
- Time-analysis tools include time cycles and price angles, and price angles have many applications, including the Gann Grid, the Gann Fan and geometric shapes.
- Gann’s square is the cornerstone of Gann price angles. From it you can derive the price angles, and it can be used to estimate reversal prices.
- Time cycles are used to anticipate turning points in the direction of price, because they measure the time factor together with price movement, not price movement alone.
- In the Gann Grid, time and price are squared based on the 45-degree angle, or the 1:1 relationship. The Gann Grid is a crossing series of Gann lines placed over the chart.
- The idea behind the Gann Fan is to use it after a top or bottom has formed, to work out the angle of the new move, along with important support and resistance levels.
- One of the concepts linked to time analysis in the forex market is Fibonacci time zones, whose strength most traders often overlook. It is one of the technical-analysis tools that many traders misunderstand.
Frequently asked questions
What is numerical analysis in forex?
It is a type of technical analysis that relies mainly on mathematical equations and primarily uses the square of nine.
What is time trading?
Through time analysis you can anticipate the time at which a reversal in price movement may happen. This type of analysis is attributed to the American analyst William Delbert Gann.
How do I learn time analysis?
You can learn time analysis by reading the articles on the trading site, and also by watching the videos we provide on our YouTube channel, which are completely free and cover all methods of technical analysis and more.
Read more: What are forex recommendations? Learn about their types and how to use them
Put the theory into practice
Concepts become far easier to understand once you see them on a live chart. A demo account gives you real market data with no capital at risk while you build familiarity.
Advertising disclosure: partner link. Easy Trade may receive compensation. Educational content, not financial advice. CFDs carry a high risk of losing your capital.
Disclaimer: This article is for educational purposes only and is not investment advice. Time analysis, Gann tools and Fibonacci time zones describe possible turning points on a chart; signals can fail and no method is accurate all of the time. Trading forex and CFDs carries a high level of risk to your capital because of leverage and may not be suitable for every investor. Some links on this site may be affiliate links, which means we may earn a commission at no extra cost to you.