
What Are Time Cycles

W.D. Gann (William Delbert Gann) argued, on the subject of time cycles, that history repeats itself. Looking back 100 years shows this clearly: in 1820 a cholera outbreak spread across the countries of Europe and killed fifteen million people, and in 1918 — nearly a hundred years later — history repeated itself when Europe suffered a disease no less deadly than the last, the Spanish flu. From this starting point Gann built his theory of time analysis. Among the tools he used to apply time analysis are the time cycles, which we cover in some detail in this article. For more, read about Gann Price-Time Angles.
What Are Time Cycles
Time cycles are one of the tools of time analysis, used to estimate when a market may reverse.
The Basis Time Cycles Are Built On
It is said that Gann made forecasts for the start and end of the world war based on earlier events and outcomes. These are simple examples of the idea that history repeats itself. We won’t go far into the details of those examples; the aim of showing them is to make clear that Gann built his theory on past history, and this is the idea that technical analysis in the financial markets rests on.
From the above we can say that, in this view, every move in the financial markets is a result of a law of nature and stems from something that came in an earlier period — that the future is treated as a repeat of the past.
On that basis Gann set out the time cycles, saying that price movement passes through a set of cycles like anything in the universe. Just as there are cycles for the four seasons, in each of which the weather changes, price movement changes direction when price enters a new cycle.
To make the idea clearer, look at the following chart.

In the previous chart you will notice that we drew the time cycles on the chart of the US dollar against the Japanese yen. Notice that the price changed direction as it moved from one time cycle to the next. At first the price had formed an uptrend; we drew the time cycles on its first two troughs, then the price reversed at the start of the third cycle, then kept changing direction whenever it began a new time cycle.
Gann divided time cycles into:
- Large time cycles
- Small time cycles
Large Time Cycles
From 5 years up to 60 years, these are:
60-Year Cycle
This is the largest and most important cycle of all. It repeats every 60 years and is made up of three 20-year cycles.
You can see its importance by looking at the war period from 1861 to 1869 and the panic that followed 1869 — the civil war in the United States and others — then history repeated itself 60 years later, from 1921 to 1929, with a series of wars between countries that had been at war sixty years earlier.
50-Year Cycle
The second most important time cycle. At the end of this cycle there are sharp rises or falls, often in the last five or seven years.
30-Year Cycle
The thirty-year cycle is very important because it is half of the 60-year cycle, or the great cycle, and it contains three cycles of 10 years each.
20-Year Cycle
Another important time cycle is the 20-year, or 240-month, cycle.
15-Year Cycle
Fifteen years is three quarters of the 20-year cycle, or 180 months (half a circle).
10-Year Cycle
The next important main cycle is the ten-year cycle, which is half of the 20-year cycle and one sixth of the 60-year cycle. It is also very important because it is 120 months, or a third of the circle.
A change of direction often happens after the end of this cycle.
7-Year Cycle
This cycle is 84 months. Gann focused heavily on this number because, in his view, it had a religious dimension. The seven-year cycle is seen as a link between two 5-year cycles that together form the ten-year cycle.
5-Year Cycle
Half of the ten-year cycle and part of the twenty-year cycle; the smallest cycle.
Small Time Cycles
The smaller time cycles are 3 years and 6 years. The smallest cycle is one year.
Note* the cycles above are not tied only to their large time frames; they can also be applied to small time frames. For example, the 10-year cycle does not have to be applied over ten years — it can be applied to any time frame, whether weekly, monthly, daily, or even the minute.
Shapes of Time Cycles

We can tell time cycles apart by their shape, as follows:
1- The three-year cycle, which we can also call the three-period cycle.

In the previous chart you will notice that the three-year cycle, or three segments, is made up of three main segments: an up segment, a down segment, then another up segment.
2- The five-year cycle
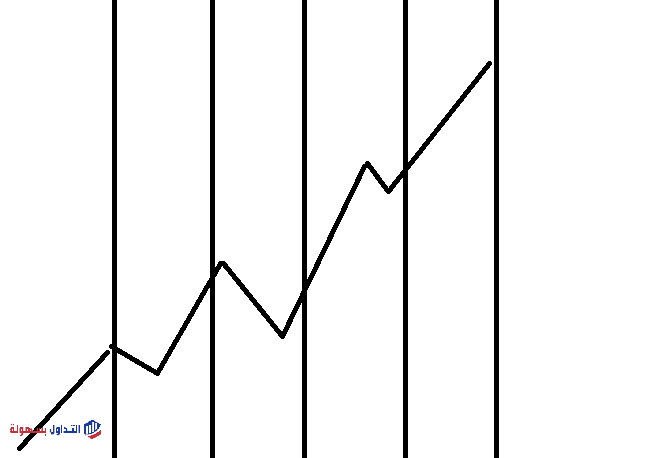
You will notice that the five-year cycle is made up of two up segments, then a down segment, then two up segments again.

3- The ten-year cycle
In the previous chart you will notice that the ten-year cycle is made up of two five-year cycles separated by a three-year cycle. That is, it consists of two up segments, then a down segment, then two up segments again — here the first five-year cycle ends; then comes the second three-year cycle, which is two down years separated by an up year; then the shape begins the second five-year cycle, which is two up years, then a down year, then two up years.
It is also clear from the previous chart that the ten-year cycle is made up of the five-year cycle plus the seven-year cycle.
How to Draw Time Cycles on a Chart
It is very simple. All you have to do is look for two consecutive tops or bottoms, on condition that they are at the start of a trend. Look at the chart.
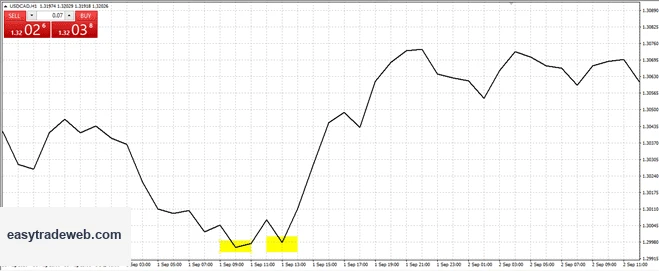
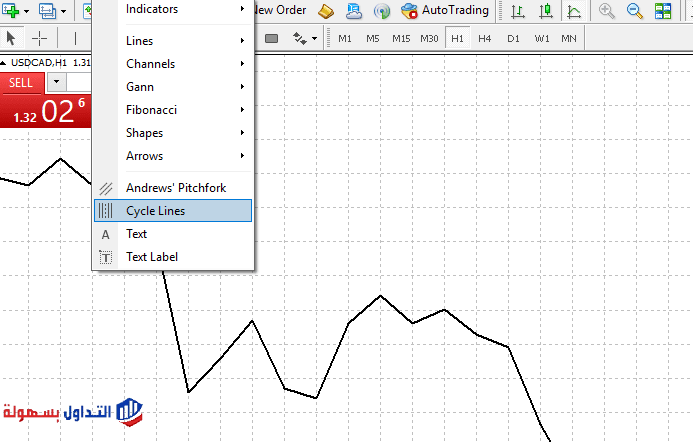
It is better to switch the chart from candles to a line chart to make drawing easier, as in the previous figure. After identifying the two troughs, go to the Insert menu, then choose Cycle lines, as in the figure.
After that you connect the two troughs, and the time periods will appear, as in the figure.
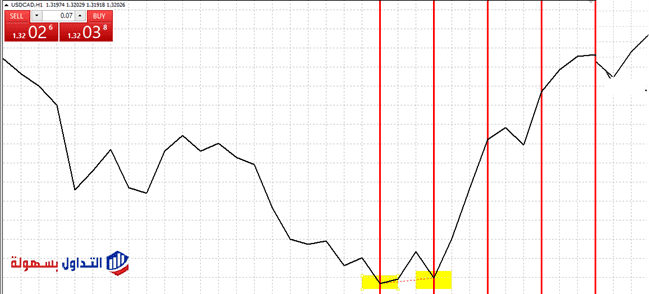
In the previous figure you will notice that the five-year cycle appeared: two up cycles, a down cycle, then two up cycles.
Conclusion
- Time cycles are one of the tools of time analysis, used to estimate when a market may reverse.
- Price movement passes through a set of time cycles like anything in the universe. Just as there are cycles for the four seasons, in each of which the weather changes, price movement changes direction when price enters a new cycle.
- The cycles above are not tied only to their large time frames; they can also be applied to small time frames. For example, the 10-year cycle does not have to be applied over ten years — it can be applied to any time frame, whether weekly, monthly, daily, or even the minute.
More: Time Analysis — What Is the Gann Grid?
Frequently Asked Questions
What is numerical analysis of stocks?
Stock analysis is the evaluation of a particular trading instrument, an investment sector, or the market as a whole, where stock analysts try to determine the future activity of an instrument, a sector, or a market.
What is numerical analysis in forex?
Using numerical analysis in forex lets us work more efficiently, because numerical indicators draw on a set of historical statistical data.
What are Gann angles?
A Gann angle is a straight line on the price chart that gives a fixed relationship between time and price. For Gann, the most important angle was the line that represents one price unit for one time unit, called the 1×1 angle or the 45-degree angle. Rather than working it out by hand, calculate the price side of the method.
What are time cycles?
While price and volume are studied heavily in relation to time, time as an independent variable of study can also produce valuable insights for trading decisions. The periodic fluctuations that affect a price series are referred to as time cycles.
What is financial astrology?
Financial astrology, or astro-analysis, is the analysis of financial matters based on watching the movements of the planets. After trading the markets for a while, it becomes apparent that a major change in trend points (CIT) often coincides with certain astrological harmonic cycles.
Put the theory into practice
Concepts become far easier to understand once you see them on a live chart. A demo account gives you real market data with no capital at risk while you build familiarity.
Advertising disclosure: partner link. Easy Trade may receive compensation. Educational content, not financial advice. CFDs carry a high risk of losing your capital.
Disclaimer: This article is for educational purposes only and is not investment advice. Time cycles and other Gann tools are analytical concepts, not forecasts; any signal they give can fail and outcomes vary. Trading forex and CFDs on margin carries a high risk of loss because of leverage and may not be suitable for every investor. This site may earn a commission from affiliate links to brokers, at no extra cost to you.