
MACD Indicator Explained

MACD indicator explained — the MACD indicator is one of the most famous and most widely used technical indicators among traders. Many trading strategies are built on it. What is it? What is it used for? What does it consist of? In this article we answer all these questions in detail.
What Is the MACD Indicator?
MACD indicator explained — it is one of the momentum indicators. MACD stands for Moving Average Convergence Divergence, meaning the convergence and divergence of moving averages. Accordingly, the MACD indicator shows the relationship between two moving averages: the 26-period exponential moving average (EMA) and the 12-period EMA.
MACD Indicator Components
The MACD indicator consists of three main elements:
- MACD indicator explained — the MACD line (the blue line), calculated by subtracting the 12-period EMA from the 26-period EMA.
- The signal line (the red line), which is the 9-period EMA of the MACD line.
- The histogram, equal to the difference between the MACD line and the signal line. The histogram reads below the zero line when the difference between the two lines is negative, and above the zero line when the reading is positive.
Note: the components above describe the two-line MACD. This differs from the MACD indicator found on the MetaTrader platform, in that it has two moving averages, as shown above.
Uses of the MACD Indicator
The MACD indicator has several uses. This article covers the most common ones.
- Spotting divergence with the MACD indicator.
- MACD line crossovers.
Spotting Divergence With the MACD Indicator
Divergence is one of the great tools in technical analysis if you incorporate it into your trading strategy. To understand divergence, let’s agree first that under normal conditions the indicator follows price movement. But if a difference occurs between price movement and indicator movement, something unusual appears to be happening, pointing to a correction or a change in price direction. This is called divergence. There are two types of divergence:
- Bullish Divergence occurs when price prints a lower low, but at the same time the MACD indicator prints a higher low. This often signals a change of direction to the upside or a correction. Look at the following chart.
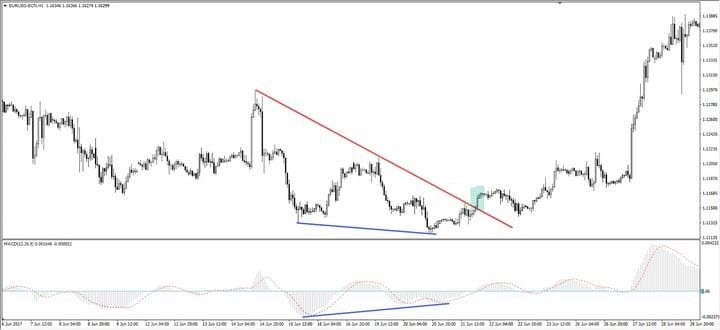
In the chart above, price made a lower low while the MACD indicator made a higher low. Notice that price did not keep falling for long and reversed to the upside.
- Bearish Divergence occurs when price prints a higher high, but at the same time the MACD indicator prints a lower high. This often signals a change of direction to the downside or a correction. Look at the following chart.
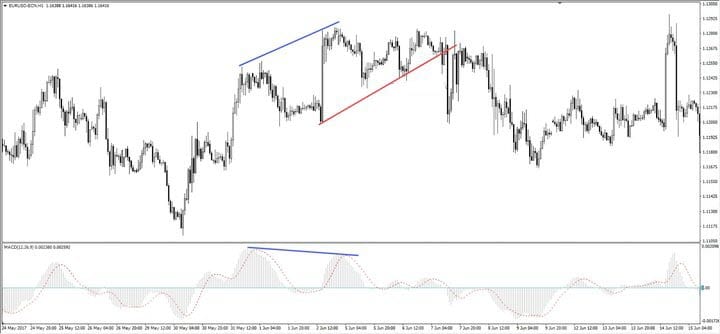

In the chart above, price made a higher high while the MACD indicator made a lower high at the same time. Notice that price did not continue for long before correcting to the downside.
MACD Line Crossovers
Another common way to use the MACD indicator is as an entry signal when the MACD line (the blue line) crosses the signal line (the red line). But before explaining this method, let’s first understand the crossovers that occur on the MACD indicator more clearly. We will add two moving averages to the chart: the 26-period EMA and the 12-period EMA — the same averages the MACD indicator is built on. Look at the following chart.
MACD indicator explained — notice in the chart above that when the 26-period EMA and the 12-period EMA cross to the upside, a crossover occurs between the MACD line and the signal line at the zero line (at that point the indicator reading is positive). Before the MACD line (the blue line) crosses the zero line, it first crosses the signal line (the red line). Likewise, a downward crossover corresponds to a downward crossover at the zero line as well (at that point the indicator reading is negative).
From the above, when the indicator reading is positive, that is evidence the trend is upward, and a crossover must first occur between the MACD line (the blue line) and the signal line (the red line) to the upside. Conversely, when the indicator reading is negative, that indicates a downward trend, and a crossover must first occur between the MACD line (the blue line) and the signal line (the red line) to the downside.
Based on the above, MACD line crossovers can be used as entry signals, but remember they should not be relied on alone — they can be combined with your own trading strategy. Look at the following chart.
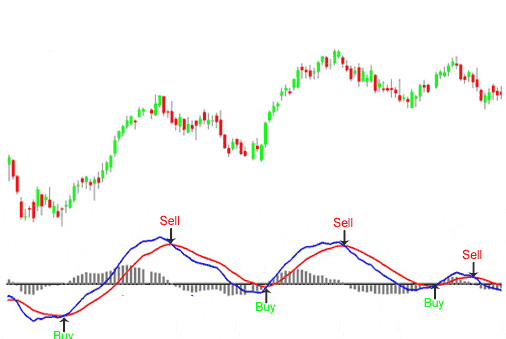
In the chart above, notice that price reversed more than once around a crossover between the MACD line (the blue line) and the signal line (the red line).
The MACD indicator has other uses too, such as confirming breakouts of support and resistance levels and trendlines, in addition to its use in day trading and scalping.
Conclusion
The MACD indicator, invented by Gerald Appel in 1979, remains one of the most widely used technical indicators in trading. Traders around the world value it for its simplicity and flexibility, and it can be used to identify either trend direction or price strength.
Divergence trading is a common way to use the chart and the MACD indicator as a tool for anticipating a change or reversal in trend, as well as overbought or oversold zones. Here are the key points to keep in mind:
- It is one of the momentum indicators. MACD stands for Moving Average Convergence Divergence, meaning the convergence and divergence of moving averages.
- The MACD indicator shows the relationship between two moving averages: the 26-period EMA and the 12-period EMA.
- The MACD indicator consists of three main elements: the MACD line, the signal line, and the histogram.
- The MACD indicator has several uses, the most notable being spotting divergence and moving-average crossovers.
Test this indicator without risking capital
Reading about an indicator is not the same as watching it behave on a live chart. A demo account lets you apply the settings above to real market data and see how the signals form before any money is involved.
Advertising disclosure: partner link. Easy Trade may receive compensation. Educational content, not financial advice. CFDs carry a high risk of losing your capital.
Disclaimer
This article is for educational purposes only and does not constitute investment advice. Technical indicators such as MACD are analysis tools, not guarantees of future price movement. CFD and forex trading involves leverage and carries a high risk of losing your money quickly. This page may contain affiliate links; if you open an account through them, Easy Trade Web may earn a commission at no extra cost to you.