
Ema Crossover Strategy

The exponential moving average (EMA) crossover is one of the most widely used forex strategies, because the moving average is among the most common technical indicators. Moving averages help traders identify trends and trade in the direction of those trends.
The EMA crossover strategy really comes down to two components: two exponential moving averages. The first step toward entering a new trend is to use two EMAs as a starting signal.
By using two exponential moving averages, one with a longer period and one with a shorter period, you can apply the EMA crossover strategy.
Step one: setting up the EMA crossover strategy
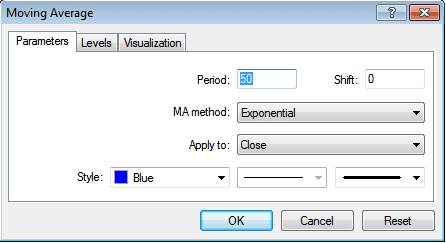
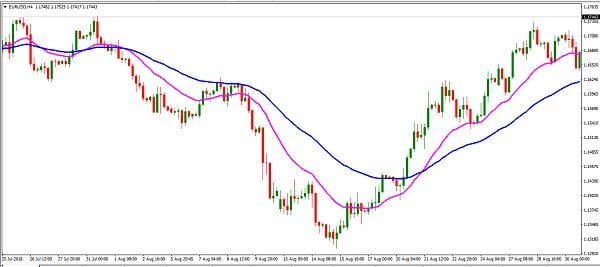
This step is about setting the chart up correctly with the right exponential moving averages so you can spot the EMA crossover in the next stage. The strategy uses the 20 and 50 period EMAs.

Read also: Forex strategy: moving average crossover
Step two of the 50-day EMA strategy
For this strategy, price needs to trade above the 20 and 50 EMAs, and we need to wait for the 20 EMA to break above the 50 EMA.

A buy entry after the crossover
The EMA crossover strategy relies on several factors to confirm a new trade idea. After the 20 and 50 EMAs cross, we again need more patience and wait for two consecutive, successful retests of the zone between the 20 and 50 EMAs. A successful retest of the zone between the 20 and 50 EMA gives the market enough time to actually develop the trend.
Now we still need to define exactly where we will buy, which leads clearly to the next step in the EMA crossover strategy.
If price successfully retests the zone between the 20 and 50 EMA for a third time, we go ahead and buy. We now have enough evidence that the bullish momentum is strong enough to keep pushing this market higher.
A buy entry after the retest
Now we still need to decide where to place the stop loss and where to take profit, which leads to the next step in the EMA crossover strategy.
After the 20 and 50 EMAs have crossed and after two consecutive retests, we now know the trend is up. As long as we are trading above the exponential moving averages, the trend stays intact.
Here we place a protective stop loss 20 pips below the 50 EMA. We add a 20-pip buffer because we understand we do not live in a perfect world and the market is prone to reversals.
Read also: Reversal zones strategy
Step three: taking profit

In this particular case, we do not want to use the same exit technique as the entry, which was based on the 20 and 50 EMA crossover.
If we wait for an EMA crossover on the other side, we would likely give back some of the potential profit, because the EMAs are still a lagging indicator.
So there are several techniques used to take profit with this strategy, such as a resistance level or the appearance of an opposite signal.
The example above is a buy trade. Use the same rules in the opposite direction for a sell.
So the EMA crossover strategy is a simple face of the technical analysis of price data, updating it continuously through an average of a set price, where the average is taken over a specific period the trader chooses.
There are advantages to using the EMA crossover strategy in your trading. Alongside choices about which type of moving average to use, the EMA crossover strategy can be adapted to any timeframe to suit long-term investors and short-term traders.
Read also: How to trade stocks for beginners
Frequently asked questions
What is the difference between a simple and an exponential moving average?
The exponential moving average (EMA) is similar to the simple moving average (SMA) in that it measures the direction of a trend over a period. However, while the SMA simply averages the price data, the EMA puts more weight on the more recent data.
What does “moving average” mean?
A moving average is a statistic that captures the average change in a data series over time. In finance, technical analysts often use moving averages to track price trends for a given security.
What does EMA stand for?
The exponential moving average (EMA) is one of the most used forex trading tools. Traders overlay the EMA on their trading charts to identify entry and exit points based on where price sits relative to the EMA.
What is the moving average indicator?
The moving average (MA) is a stock indicator commonly used in technical analysis. It helps smooth price data by creating a constantly updated average price. A rising moving average suggests the security is in an uptrend, while a falling moving average suggests a downtrend.
Try this strategy on a demo account first
A strategy that looks clear in an article can behave very differently under real spreads and volatility. Testing it on a demo account shows you how it performs before you commit any capital.
Advertising disclosure: partner link. Easy Trade may receive compensation. Educational content, not financial advice. CFDs carry a high risk of losing your capital.