
Keltner Channel Explained: Which Version Your Platform Draws

Two traders add a Keltner Channel to the same EURUSD chart, both leave the settings alone, and get bands of different widths sitting in different places. Neither has made a mistake. The name covers more than one calculation, and which one appears depends on the platform that drew it.
That matters the moment a rule is copied from somewhere else. A setup described as price closing outside the upper Keltner band is a different event on a chart centred on the close than on one centred on typical price, and different again where the band width comes from the bar range rather than from true range. What follows is which construction each documented default produces.
Key takeaways
- A Keltner Channel is a centre line with a band above and below, but the inputs each platform documents are not the same set, so settings that look identical do not produce identical bands.
- Chester Keltner described the original in 1960 and called it the ten-day moving average trading rule, making no claim to originality; the name in use today was applied by others.
- That centre line was a ten-day simple moving average of typical price and the width a ten-day simple moving average of the high-low range: no exponential average, no average true range, no multiplier.
- True range extends to the previous close, so a gap widens a modern Keltner band and leaves a band built on the bar range where it was.
- TradingView documents Close as the default price source, which means the default modern channel is not centred where the original was centred.
Table of contents
- Which Keltner Channel Your Platform Is Drawing
- What Chester Keltner Described, and What He Called It
- Why Swapping the Range Measure Changed the Indicator
- The Inputs Differ by Platform, Not Just Their Values
- What a Band Touch Can and Cannot Tell You
- Against Bollinger Bands: the Same Shape, a Different Denominator
- Questions Readers Ask About Keltner Channels
- Reproducing a Keltner Setup From Another Platform
Which Keltner Channel Your Platform Is Drawing
Three questions settle it, and all three are answered inside the indicator settings dialogue rather than on any chart.
The first is what the centre line averages. If the dialogue offers a price or source field, read its value: a channel centred on the close and a channel centred on typical price sit at different heights on any bar with a long wick, and every band drawn from them inherits that offset.
The second is what sets the band width. Modern versions use average true range multiplied by a factor. The version Keltner described used the average bar range, a different quantity on any chart that gaps.
The third is how many periods the dialogue lets you set. Where the centre line period and the range period are separate fields, changing one leaves the other alone. Where a single length field feeds both, a setup specifying two different numbers cannot be reproduced.
None of this is visible from the plotted lines. A Keltner Channel looks the same whichever construction produced it, which is why it gets compared with Bollinger Bands far more often than with another Keltner Channel.
What Chester Keltner Described, and What He Called It
The construction dates to 1960 and the book How To Make Money in Commodities. Its centre line was a ten-day simple moving average of typical price, the high, low and close of the bar averaged together. The width was a ten-day simple moving average of the distance between the high and the low, added above the centre line and subtracted below it.
There is no exponential average in that description, no average true range, and no multiplier to raise or lower. The two averages share one period because there is only one period to set.
The name came later and from other people. The Wikipedia article records that Keltner called it the ten-day moving average trading rule and made no claim to originality, and that the modifications in use today were published by later authors. A page opening with the claim that Keltner introduced the Keltner Channel is reporting an attribution rather than an event.
That has a practical use. When a source calls its settings the original ones, the settings it means are ten and ten on simple averages of typical price and bar range, not a twenty-period exponential average with a multiplier of two.
Why Swapping the Range Measure Changed the Indicator
True range is not the height of the bar. MetaQuotes and thinkorswim define it identically, and both take the largest of three distances: this bar measured from its own high to its own low, this bar high measured back to the close that preceded it, and that earlier close measured down to this bar low.
Two of those three measure from a price belonging to the previous bar. The bar range measures only within the current one. On any bar opening away from where the last one closed, true range exceeds the bar range by the size of the gap, and on every other bar the two are equal.
The consequence sits on the chart every Monday. A currency pair opening away from the Friday close produces one bar whose true range carries the whole weekend move, so a channel built on true range widens there. A channel built on the average of the bar range does not register the gap at all, because it happened between two bars rather than inside one.
The same difference shows on a share CFD at every session open and never shows on an instrument that trades continuously. The substitution is therefore not a refinement of one measurement. It changed what the width responds to, and only for instruments that gap.

The Inputs Differ by Platform, Not Just Their Values
The clearest way to see the problem is to put three sets of vendor documentation side by side and read the parameter lists rather than the defaults.
| Documented input | StockCharts SharpCharts | TradingView | thinkorswim |
|---|---|---|---|
| Centre line period | Length of the exponential average | Length, 20 by default | length |
| Type of average | Exponential | Use Exponential MA, a toggle | Five types offered |
| Price the centre uses | Not exposed | Source, Close by default | price |
| Range period, set separately | Time periods for the ATR | Not documented separately | true range average type |
| Band multiplier | Multiplier for the ATR | Multiplier | factor |
| Shift of the whole study | Not exposed | Not exposed | displace |
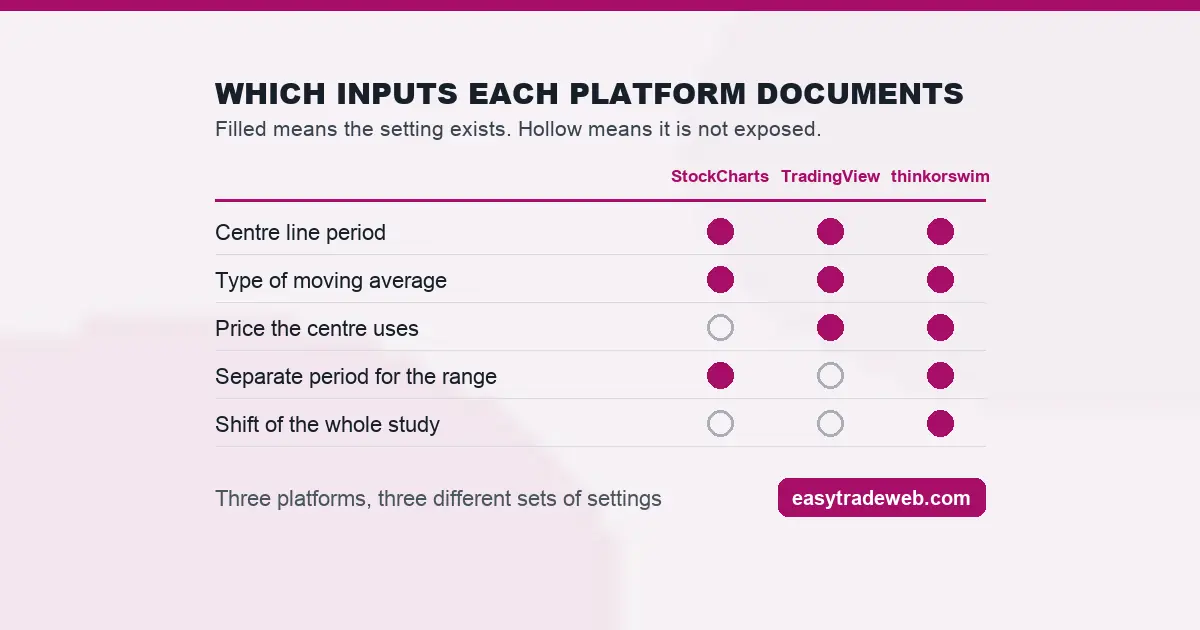
Three rows carry the weight. Only one documents the price the centre line uses, so on the other two a reader cannot tell whether the channel is centred on the close or on typical price. Only two expose a separate period for the range. And one platform can shift the entire study backwards in bars, moving the band relative to price without changing any average.
The type of average compounds it. Where five types are offered for the centre line, four produce a channel no other platform can reproduce, and the same choice exists again for the range. That is a wider space of outputs than the phrase default settings suggests. Why a smoothed average keeps old bars in scope is set out in our note on smoothed averages on a chart.
What a Band Touch Can and Cannot Tell You
A band is the centre line plus a multiple of an average. Price reaching it says the distance from the average has reached that multiple, and nothing else. It is not a level anyone transacted at.
Two channels on the same chart with different multipliers therefore disagree about the same bar, and both are correct within their own definition. A rule written for a touch at two multiples is not a rule for a touch at one and a half.
What the width carries is the recent average size of the range, which is why the bands widen through an active session and narrow through a quiet one. It is also why a close outside the band is a poor standalone entry: the same expansion that pushed price through the line widened the line, which runs into the problem set out in our note on a breakout that does not hold.
Against Bollinger Bands: the Same Shape, a Different Denominator
Both draw a centre line with a band either side, set a multiple of something away from it. The something is where they part. A Bollinger band uses the standard deviation of price around the average, a measure of how spread out the closes have been. A Keltner band uses an average range, a measure of how large the bars have been.
One practical consequence follows: a series of small bars trending steadily produces a wide Bollinger band and a narrow Keltner band, because the closes are dispersed while the bars are not. The reverse happens on a choppy series of large bars that ends where it started.
The three-way comparison, including where a channel built on actual highs and lows fits against both, already sits on our page explaining how a Donchian channel is built, and that is the place to continue with it rather than repeating it here.
Questions Readers Ask About Keltner Channels
Which Keltner Channel settings are the right ones?
No exchange, regulator or platform vendor publishes a correct value, so any figure offered as the right one is an opinion. What can be stated is what each input does. A longer centre line period responds later to a change in direction. A longer range period averages more bars into the width. A larger multiplier moves both bands further out and reduces how often price reaches either.
Does the original Keltner formula use average true range?
No. The description from 1960 used a ten-day simple moving average of typical price for the centre line and a ten-day simple moving average of the high-low range for the width. Average true range was introduced by later authors, and it is what almost every platform now uses by default, so a chart drawn today is very unlikely to be showing the original construction.
Why do two platforms draw different Keltner Channels on the same chart?
Because the inputs they document are not the same set. One exposes a separate period for the range and another does not. One lets you choose the price the centre line averages and defaults it to the close. One lets you choose among five types of moving average for the centre line and again for the range. Two charts can therefore carry the same nominal length and multiplier and still show different bands.
Is a Keltner Channel better than Bollinger Bands?
Neither is better as a general matter, because they measure different things. A Bollinger band is a multiple of the standard deviation of price around the average. A Keltner band is a multiple of an average range. They answer different questions and will disagree with each other on the same chart, which is a property of the two definitions rather than a fault in either.
Are Bollinger Bands part of the Keltner Channel?
No. They are two separate indicators that share a shape. Some traders plot both and watch for one pair of bands sitting inside the other, but that is a technique applied to two independent studies, not a case of one containing the other.
Reproducing a Keltner Setup From Another Platform
Anyone copying a channel rule from a video, a forum post or a course can check whether the chart in front of them is the same instrument the rule was written for. Four steps settle it.
Open the settings dialogue and write down every field it offers, not only the ones holding numbers. Find the price or source field and confirm what the centre line averages. Check whether the range has a period of its own or shares the centre line period. Then confirm the type of average, since a choice of five means four options are unavailable elsewhere.
If any of the four cannot be matched, the rule cannot be reproduced exactly, and the number in the source is a starting point rather than a specification. Set the values before looking at the chart, so they are not chosen by which ones would have caught the last few swings.
Risk warning: this page is educational and describes how an indicator is calculated and documented. It is not advice to open, hold or close any position, and no indicator setting produces a profit. Bands are derived from past prices and say nothing about future prices. Leveraged trading carries a high risk of loss.