
Best Scalping Indicator for MT4: What to Check Before Use

There is no single best scalping indicator for MT4. MetaTrader 4 comes with 30 built-in indicators, and the arrow indicator on this page is a custom file added on top of them. On a 1-minute or 5-minute chart, it is usable only if its arrows stay put after each bar closes and its targets clear the spread.
What follows is that arrow indicator as it is usually set up: how it signals, its buy and sell rules, its four settings, and the checks that decide whether it deserves a live account. For the standard tools scalpers combine with it, see the guide to the best scalping indicators, and for a simpler arrow tool, the scalping buy and sell signal indicator.
Key takeaways
- MT4 ships 30 built-in indicators. An arrow scalping indicator is a separate custom file, and MetaQuotes documents nothing about when its arrows appear.
- The arrows mark momentum building. They line up with a clear trend or a tight range and misfire when price has no direction.
- The rules pair a 15 to 20 pip stop with an exit at the opposite arrow, so one full stop can cancel three or four 5-pip winners.
- Four inputs control the arrows, and the Visualization tab lets one copy run on the 1-minute chart and another on the confirming timeframe.
- Before a live account, confirm the arrows do not move once a bar closes and that the spread still leaves room for the target.
Table of contents
What MT4 Ships, and Where a Custom Arrow Indicator Fits
The MQL4 reference lists 30 built-in technical indicators, from Moving Average and Bollinger Bands to RSI and the Stochastic Oscillator. The MetaTrader 4 help then sorts indicators into two working groups by how they time a turn in price.
Anything outside that list is a custom indicator, and every buy and sell arrow tool falls in this group. It is a file installed into the terminal and dragged onto a chart from the Navigator window, the same way a built-in one is added.
The split matters for a scalper. A built-in indicator has a published formula, so a signal on a closed bar can be recalculated and checked. A custom arrow file runs whatever logic its author wrote, and nothing in the MetaTrader documentation says when its arrows appear or whether they can move.
The same file can also drive an automated system, because MQL4 hands custom indicator values to an Expert Advisor through its iCustom function. That does not make the arrows more reliable. The robot reads whatever values the author’s code writes, including values on the bar that is still forming.
| Indicator type | Examples on MT4 | Timing, in the MetaTrader 4 help | What a scalper can verify |
|---|---|---|---|
| Trend indicators | Moving Average, Parabolic SAR | Detect a turn at the same moment as price, or after it | The formula, so any past signal can be recalculated |
| Oscillators | RSI, Stochastic Oscillator | Can flag a turn before price makes it, or at the same moment | The formula and the levels its signals are read from |
| Custom arrow indicator | The scalping indicator on this page | Not documented; set by the author’s code | Only its behaviour, by watching the arrows across closed bars |
Indicator count and timing wording checked against MetaQuotes documentation on 17 September 2026.
How This Arrow Indicator Signals
The indicator gauges momentum and draws an arrow when it builds: blue for a possible move up, red for a possible move down. It attaches to any currency pair and any timeframe, although the rules further down are written for fast charts.
It behaves like a trend-following tool. When a pair moves steadily in one direction, or swings inside a narrow and well-defined range, the arrows tend to line up with the move. When price drifts without direction or jumps on sudden volatility, arrows print on both sides in quick succession and most lead nowhere.
The first arrow of a new move is the one a scalper wants, because it lands close to where that move begins. The difficulty is on the lowest timeframes: an arrow can appear while a bar is still forming and vanish once the bar closes, after an order has already gone in. Whether that is ordinary live-bar movement or past signals being redrawn is set out in repainting indicators, and it is the first thing to test.
The 1-minute chart throws off more false arrows than slower charts, so the rules below confirm each arrow on a higher timeframe before acting on it.
The rules do not name that confirming timeframe. Whichever one is chosen, keep it fixed for the whole test: switching from the 5-minute to the 15-minute chart after a losing run turns a check into hindsight.
The Buy and Sell Rules, With the Arithmetic
Buy setup
- Look for a blue arrow on the chart
- Wait until the price bar turns up
- Enter at the blue arrow
- Place the stop loss 15 to 20 pips from the entry price
- Exit when a red arrow appears
Sell setup
- Look for a red arrow on the chart
- Wait until the price bar turns down
- Enter at the red arrow
- Place the stop loss 15 to 20 pips from the entry price
- Exit when a blue arrow appears
Look at what the two rules ask of each trade. The stop sits 15 to 20 pips from entry, but the exit has no fixed target: the trade closes whenever the opposite arrow prints, which on a 1-minute chart can be only a few pips later.

That makes the arithmetic lopsided. If a typical winner closes 5 pips ahead and a loser runs to a 15-pip stop, one stopped trade cancels three winners. At a 20-pip stop it cancels four. Before asking how often the arrows are right, compare the average pips on winners with the stop distance.
The spread comes off every trade, winners and losers alike. A spread of 2 pips, used here only as an example, takes 40 percent of a 5-pip winner. That is why the account matters as much as the indicator, and the cost side is worked through in the account rules for scalping.
Indicator Settings
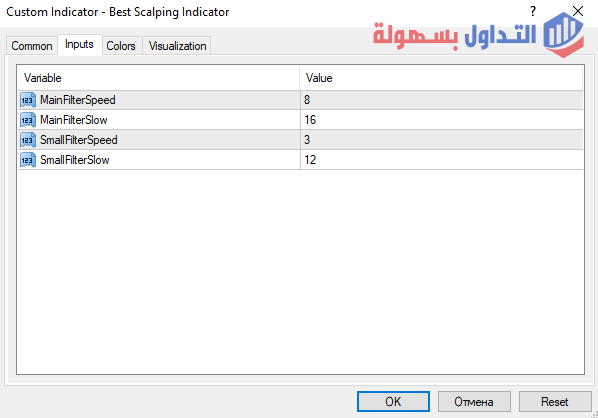
The indicator has four inputs:
- MainFilterSpeed sets the speed of the main arrows
- MainFilterSlow sets the value for the slow main arrows
- SmallFilterSpeed sets the value of the small arrows on the chart
- SmallFilterSlow sets the speed of the slower small arrows
Change one input at a time and compare the arrows over the same stretch of closed bars. Changing two at once leaves no way to tell which one altered the signals.
MetaTrader 4 can show each copy of an indicator on chosen timeframes only, through the Visualization tab in its settings. Attach the indicator twice, once tuned for the 1-minute chart and once for the confirming timeframe, and each set of arrows stays on the chart it was tuned for.
Test this indicator without risking capital
Reading about an indicator is not the same as watching it behave on a live chart. A demo account lets you apply the settings above to real market data and see how the signals form before any money is involved.
Advertising disclosure: partner link. Easy Trade may receive compensation. Educational content, not financial advice. CFDs carry a high risk of losing your capital.
Three Checks Before It Trades a Live Account
- Record where the arrows are, then come back. Screenshot the last hour of arrows on a 1-minute chart, wait at least another hour, and compare. An arrow on a closed bar that has shifted or disappeared means the signals shown in history were not the signals available at the time.
- Confirm on the higher timeframe. Keep the 1-minute copy and the confirming copy on separate timeframes as described above, and count only an arrow that agrees with the slower chart.
- Price the trade before trusting the signal. Read the spread in the Market Watch window at the hours you plan to trade, subtract it from the pips a typical winner makes, and check that what remains still covers the stop arithmetic above.
Keep a written log while the checks run: time, direction, the spread at entry and the pips at exit for every arrow taken. A few dozen logged trades say more about this indicator than any screenshot of past arrows, because the log only records signals that existed in real time.
A demo account runs all three checks without money at risk, and what forex scalping involves covers the discipline and risk side. If the arrows pass and the numbers still work, the strategy around them comes next; the 1-minute scalping strategy is one starting point.
When This Indicator Is the Wrong Tool
Around scheduled economic releases, price can gap through a 15-pip stop in a single tick, and an arrow printed seconds before the release reflects conditions that no longer hold.
In a sideways session with no defined range, the indicator still reads momentum in both directions. The result is arrows on each side and a run of small stopped trades.
A trader who cannot watch the chart is poorly served too. The exit depends on the next opposite arrow rather than a fixed target, so an unattended position carries its full stop risk until someone sees that arrow.
And where the account spread is wide against the target, even a well-timed arrow cannot pay for the trades that reach their stop.
For why a signal can look better on a historical chart than it ever traded, the explanation of look-ahead bias is the natural next read.
Disclaimer: This article is for educational purposes only and is not investment or trading advice. Trading forex and CFDs on margin is high risk and does not suit every investor, and a leveraged position can lose more than the money first deposited. This page may contain affiliate links, meaning we may earn a commission if you sign up through them, at no extra cost to you.