
Fibonacci Confluence Strategy Forex

The Fibonacci confluence strategy can be one of the most important forex trading tools. When two Fibonacci retracements or extensions line up at the same point, that overlap makes a strong combination.
What the Fibonacci confluence strategy is
The idea behind the Fibonacci confluence strategy in foreign exchange trading is one that most traders arrive at after using the Fibonacci tool for a while.
Usually you draw Fibonacci retracements or extensions and look for a Fibonacci level that lines up with other signals such as support and resistance, pivots, and so on. The idea of the Fibonacci confluence strategy can be an interesting discovery. Why?
Because this is often all you need to trade: two strong Fibonacci levels in an area already known for support and resistance, for example, may well produce some kind of usable reaction. Many traders find the simplicity of the Fibonacci confluence strategy appealing and use nothing else in their trading.
Examples of the Fibonacci confluence strategy
As usual, giving examples on the chart is probably the best way to explain the concept.
Take any chart with a reasonable rise or fall in price, along with several moderate swings along the way, and just start drawing Fibonacci on that chart:
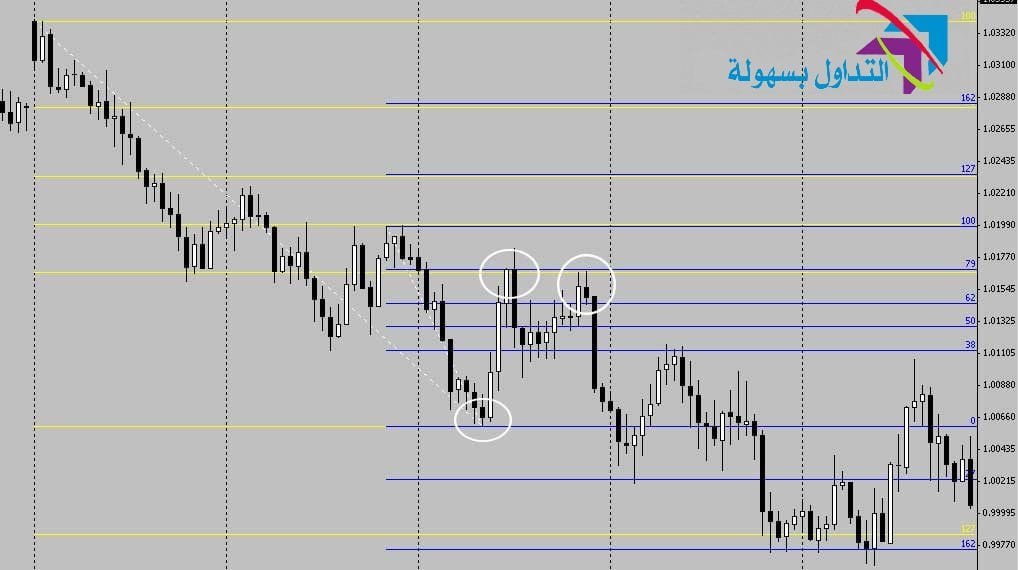
The example above shows two sets of Fibonacci drawn on a strong downtrend. The yellow Fibonacci lines come from dragging from the top left of the chart down to the bottom, which is the swing marked in the first white circle. The blue Fibonacci lines come from dragging from a lower swing high (which happens to form a double top) down to the same swing low as the yellow Fibonacci.
You can see two possible entry points where the yellow 38% Fibonacci retracement level meets the blue 79% Fibonacci retracement level. Before relying on an estimate alone, check the confluence levels numerically.


The chart above shows a similar situation in an uptrend. Again, the white circle points to an entry opportunity on a bullish candle pattern where the 79% and 38% retracement levels meet.
Note that the confluence can be made up of any of the Fibonacci retracement levels, from 38% to 50% to 62% to 79%.
There is also an opportunity to take trades based on confluence points that occur at Fibonacci extension levels. The process for finding these confluence points is the same: on any chart, draw Fibonacci lines (with extension levels enabled) and look for the levels that overlap.
Supporting signals for the Fibonacci confluence strategy
Almost every trader has a trading style or a set of strategies they use to guide their decisions and keep their emotions under control. The Fibonacci confluence strategy relies on hard data, and if a trader sticks to their strategy there should be minimal emotional interference.
The Fibonacci confluence strategy discussed above can be applied to both long-term and short-term trades, and given the nature of currency movements, most trades are carried out on a short time frame.
As always, remember to trade alongside a set of other events and signals when they are available. The strongest supporting signals are:
- Support and resistance levels
- Pivots
- Round numbers
- Fibonacci levels
- Candlestick patterns
- Trend
Try this strategy on a demo account first
A strategy that looks clear in an article can behave very differently under real spreads and volatility. Testing it on a demo account shows you how it performs before you commit any capital.
Advertising disclosure: partner link. Easy Trade may receive compensation. Educational content, not financial advice. CFDs carry a high risk of losing your capital.