
Gartley Pattern Indicator Explained

If you’re looking for a MetaTrader indicator to spot the Gartley pattern, in my experience it works well and you can use it as a helper alongside your own trading strategy.
Let’s be honest: trying to plot a Gartley pattern by hand is a waste of time. It isn’t just one thing you’re looking for — there are several other elements that make up the Gartley pattern.
That’s why a Gartley pattern indicator is genuinely useful — it removes the manual work.
All you need to do is install the indicator and attach it to your MetaTrader charts.
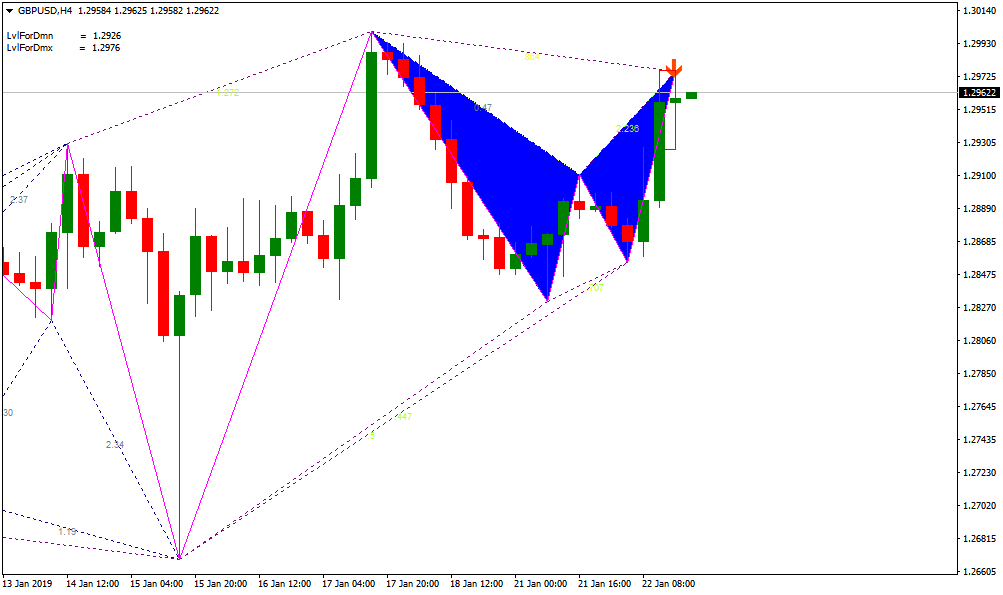
This Gartley pattern indicator works on all timeframes, so if you don’t see the pattern on the 1-hour chart, try the 4-hour chart.
If you can’t see it on the 4-hour chart, try the daily chart. Why? Because a Gartley pattern can form on the 4-hour chart but not on the daily chart.
Trading Rules for the Gartley Pattern
Because the Gartley pattern belongs to the harmonic pattern family, every swing point or price turning point has to line up with a specific Fibonacci retracement level. The points below, in turn, are what give the Gartley pattern its shape:
- XA leg: the starting point of the Gartley pattern. The XA leg has no confirmation criteria of its own for the pattern’s formation.
- AB leg: the second leg of the Gartley pattern, where the action and the pattern’s formation begin. The distance should be about 61.8% of the XA leg, so the AB leg moves in the opposite direction to XA.
- BC leg: the third leg of the Gartley pattern. This leg moves in the direction of the initial XA leg and typically reverses direction from point B. It should complete near the 38.2% Fibonacci level, or it can extend to 88.6% of the AB leg.
- CD leg: again a reversal wave, with price turning near point C. If the BC leg completed near 38.2% of AB, this leg should extend to 127.2% of BC. If instead the BC leg completed near 88.6% of AB, this leg should extend to 161.8% of BC.
- AD leg: the final rule of the Gartley pattern, marking the completion of the CD leg. The AD leg typically retraces to 78.6% of the XA move, after which you can expect the price to reverse or bounce.
Of course, having to keep all these retracement and extension levels in mind while trading in real time can get a bit overwhelming, which is why the Gartley pattern indicator for MetaTrader 4 is such a useful tool.

How to Trade Using the Gartley Pattern Indicator
The Gartley pattern indicator is a very easy-to-use technical indicator. Once it’s installed in your indicators folder, you can drag and drop it onto whichever chart you choose. As for configuration, the only thing you can set here is the colors, which can be useful depending on whether you’re using a light or dark chart background.
Once the indicator is installed, it starts working right away. We recommend testing the Gartley pattern indicator for MetaTrader 4 first on a demo account and trading based on the patterns before using it on a live trading account — this will also help you get more familiar with how the indicator behaves.
Test this indicator without risking capital
Reading about an indicator is not the same as watching it behave on a live chart. A demo account lets you apply the settings above to real market data and see how the signals form before any money is involved.
Advertising disclosure: partner link. Easy Trade may receive compensation. Educational content, not financial advice. CFDs carry a high risk of losing your capital.
One more point worth noting: the arrows the indicator draws to flag potential reversal zones can repaint. That means once an arrow appears on the chart, there’s a good chance it will be redrawn once a new low or new high forms.
The Gartley pattern also keeps adapting to whichever timeframe you choose, so on different timeframes you may come across different patterns.
All told, the Gartley pattern indicator for MetaTrader 4 is a simple but effective tool that can be useful when used correctly — completing a Gartley pattern takes a solid amount of experience.
That said, the indicator does a good job of pointing you in the right direction. You can simply open your price charts and drop the indicator onto whichever timeframe you choose.
You can then check back on the charts to see if any potential Gartley pattern is forming, keeping in mind the caveats we mentioned when trading the Gartley pattern.
Disclaimer: This article is for educational purposes only and is not investment advice. The Gartley pattern indicator described here highlights potential price zones based on Fibonacci ratios — it does not guarantee any outcome, signals can repaint, and trading results vary. Trading forex and CFDs involves leverage and carries a high risk of loss of capital. This article may contain affiliate links; we may earn a commission if you sign up through them, at no extra cost to you.