
Best Japanese Candlestick Patterns

Japanese candlesticks spark plenty of debate among traders about how reliable candlestick patterns really are. Whatever your experience with candlesticks has been, one thing is certain: they capture the psychology of everyone in the market in a small, visually striking package. This article walks you through the most important candlestick patterns and what they mean.
Japanese candlesticks are a type of price chart that shows the open, close, high, and low for a given time period. The people credited with inventing Japanese candlesticks were Japanese rice traders centuries ago, and they were popularized among Western traders by a broker named Steve Nison in the 1990s.
The Most Famous Types of Japanese Candlesticks
Doji:
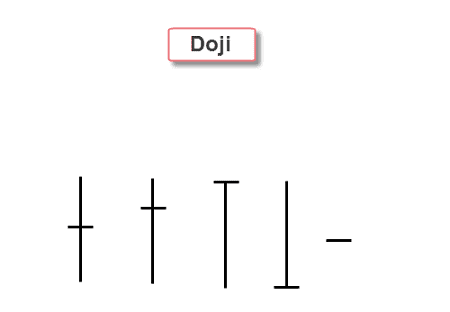
The Doji is one of the most important Japanese candlesticks. Its open and close prices are the same, which means the Doji has no real body. It can form on its own or alongside other patterns, such as the morning or evening Doji star, and it is a reversal pattern.
Doji signals indecision in the market: neither buyers nor sellers managed to push price away from the opening level during the session, leaving no real body. It often forms at tops, at bottoms, or at the end of a trend.
Hammer:
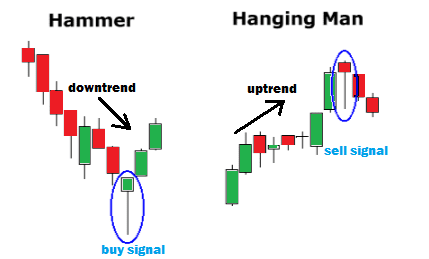
The Hammer is a strong reversal pattern that usually forms at the end of a downtrend. It has a long lower shadow and a small body, with the shadow at least twice the length of the body. In terms of market psychology, the Hammer tells us buyers managed to push price back up after selling pressure, as shown by the long lower shadow.
When this same shape forms at the end of, or during, an uptrend, it’s called a Hanging Man. It has the same characteristics as the Hammer, except the long lower shadow now signals that upward momentum may be running out as selling pressure builds.
Engulfing Pattern:
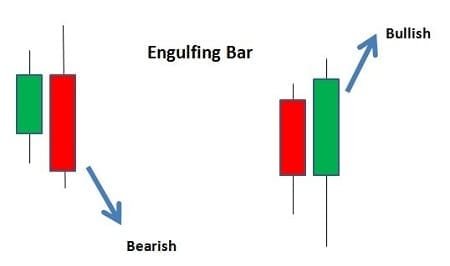
Unlike the Doji, the Hammer, and the Hanging Man, which are single-candle patterns, the Engulfing pattern needs at least two candles to form. It’s a very significant reversal pattern: the second candle completely covers the range of the first. In a bearish Engulfing pattern, the down candle fully covers the previous up candle, and in a bullish Engulfing pattern, the up candle fully covers the smaller down candle that came before it.
Best Japanese Candlestick Patterns
In this article, we’ll look at some of the strongest Japanese candlesticks you’ll come across in your trading. These form over a single trading period and often act as the building blocks of longer trend patterns. Here are the candlestick types worth watching for.
Spinning Tops:
A Spinning Top forms when a candlestick has a long upper wick and a long lower wick around a narrow body. It shows up when the market has a wide trading range but only a small difference between the open and the close.
Unlike most candlestick patterns, it doesn’t really matter whether the Spinning Top forms as a red or a green candle — all that’s needed is a small body and long wicks. When a Spinning Top forms, buyers and sellers are essentially fighting each other to a standstill, so there isn’t much real movement in the trend.
Technical traders also treat Spinning Tops as a sign of weakness in an ongoing trend. If the market forms a Spinning Top after a long upward move, the trend may be losing steam. Conversely, if a Spinning Top appears after a sustained downtrend, the uptrend that follows may gain strength — which is why it’s classed as a reversal pattern.
Marubozu:
The word Marubozu comes from the Japanese for “bald,” meaning a candlestick with no wick at all. That means:
- A green Marubozu opens at its low and closes at its high.
- A red Marubozu opens at its high and closes at its low.
If you picture the price action inside a green Marubozu, there’s no movement above or below the open and close prices at all:
As you can see, this makes the green candle a clear sign of bullish sentiment — the buyers pushed the market price up with little resistance from the sellers.
If it happens as part of an uptrend, technical traders read it as a signal the upward move will continue. If it happens after a downtrend, the downward move may continue instead.
The red Marubozu is exactly the opposite: it tells you sellers were in near-total control of the session. As a result, a downtrend can continue or an uptrend can reverse — this pattern is a continuation pattern.
Doji:
In the Doji pattern, the open and close prices are exactly equal, so the body appears as a very thin line, usually under 5% of the candle’s total range.
Like the Spinning Top, this can tell you the market is caught in a tug-of-war between buyers and sellers by the end of the session. There are four main types of Doji worth knowing:
- Long-legged Doji: has a long wick above and below the body.
- Gravestone Doji: has a tall wick above the body and nothing below it.
- Dragonfly Doji: has a long wick below the body and a small or non-existent wick above it.
- Four-price Doji: has no wick at all.
A Doji is often taken as a sign of an approaching reversal, which is why it’s classed as a reversal pattern. If a Doji forms after a broad uptrend, the market may be about to reverse downward, and vice versa.
Hammer:
If the market forms a Hammer after an extended move down, technical traders believe an upward push may be about to begin. You can spot a Hammer by its long wick below a relatively short body, with little or no wick above. The body should be two to three times shorter than the lower wick.
This shows the market set a new session low but then bounced back and closed well above it. So while there was heavy selling pressure, buyers stepped in and pushed the sellers back before the close. Although the Hammer is a reversal pattern, that doesn’t necessarily mean a reversal is imminent.
Inverted Hammer:
The Inverted Hammer looks exactly like a regular Hammer, just flipped upside down: a relatively short body sits below a tall upper wick, with only a small range beneath it.
This pattern also shows up after downtrends and is a possible signal that an upward reversal is on the way. The upper wick shows that buyers took control of the market during the session but ran into resistance from sellers. Even so, sellers weren’t able to push the price any lower, which means the downtrend may be fading — hence it’s a reversal pattern. As with Hammers, it’s usually best to wait for confirmation, typically in the form of an up candle right afterward, before opening a long position.
Hanging Man:
The Hanging Man pattern looks identical to the Hammer — the only difference is where it appears. While the Hammer shows up after a falling market, the Hanging Man appears after an uptrend. It’s read as a sign that selling sentiment is building against the buyers, so a reversal may be close.
This pattern means sellers were pushing into the market but met strong resistance, and the upward move didn’t continue — so the trend may be about to reverse, which makes this a reversal pattern. A red Hanging Man is usually seen as a stronger signal than a green one, though both are considered bearish patterns.
Shooting Star:
The Shooting Star can be described as similar to an Inverted Hammer, but like the Hanging Man, it appears at the top of an uptrend rather than at the bottom of a downtrend.
In a Shooting Star, the session starts with buyers still in control, but sellers quickly take over and pull the asset’s price back down.
- In a green Shooting Star, the trend reverses upward.
- In a red Shooting Star, the trend reverses downward.
Both signal that a reversal may be near, but as with the Hammer, the Inverted Hammer, and the Hanging Man, it’s usually a good idea to wait for fresh bearish market signals before trading.
Engulfing Pattern:
In the Engulfing pattern, a candlestick is immediately followed by another, larger candle in the opposite direction.
In a bullish Engulfing pattern, the red candle is dwarfed by the green candle that follows it, and technical traders may read this as a sign the trend is reversing upward. That means a significant upward move could be on the way, especially if the bullish Engulfing pattern appears after a period of consolidation or sideways movement — and the reverse is true for the bearish version.
Harami Pattern:
The Harami pattern is essentially the reverse of an Engulfing pattern: a candlestick is followed by a much smaller candle in the opposite direction. The name Harami comes from the Japanese word for “pregnant,” because some believe the pattern resembles a pregnant woman. In a bullish Harami, a red candle is followed by a green candle fully contained inside the previous candle’s body — often read as a sign the downtrend may be ending.
In a bearish Harami, the opposite happens: a green candle is followed by a smaller red candle. In both cases, the size of the second candle’s body is used to gauge the strength of the signal — the smaller it is, the stronger the signal.
If the Harami is followed by a smaller Doji-bodied candle, it’s known as a Harami Cross.
Tweezers Pattern:

In the Tweezers pattern, two matching candlesticks appear in opposite directions after an up or down market. Tweezers are taken as a sign of an approaching reversal, making this a reversal pattern.
The first candle in the Tweezers matches the prior trend: in an uptrend it will be green, with a short body near the top and a long wick below it. In a downtrend, it will be red, with a short body near the bottom and a long wick above it. The second candle is the opposite color but matches the shape, so the two together look like a pair of tweezers.
Morning Star:
The Morning Star comes into play when the market reaches a point of indecision after an extended downward move and then starts to climb. It’s a reversal pattern made up of three candlesticks:
- A red candle with a large body, part of the downtrend.
- A short-bodied candle, often a Spinning Top, showing that buyers are entering the session.
- A green candle with a long body, confirming the reversal has begun.
Traders may read this as a signal that the reversal is confirmed and a lasting uptrend is underway.
Evening Star:
The Evening Star is the mirror image of the Morning Star: an uptrend hits a point of indecision and then begins to correct downward. It looks like the Morning Star, but with a green candle at the start after an extended uptrend and a red candle at the end.
Both Morning and Evening Stars can form with a Doji in the middle candle. This points to a stronger period of indecision and is sometimes read as a sign that the following move will be more pronounced.
Three White Soldiers:
The Three White Soldiers pattern appears after an extended downtrend, and technical traders use it as one of the clearest signs that the bear market is ending — it’s a reversal pattern.
The three soldiers are:
- A green candle after a downward move.
- Another green candle, with a body larger than the first and only a small upper wick.
- A third green candle with a body at least matching the second candle’s wick, and very little wick at all.
Three Black Crows:
The Three Black Crows pattern is the mirror image of the Three White Soldiers. It appears after an uptrend and consists of three consecutive, progressively longer red candles, and it’s viewed as a strong signal that the bull market is ending — a reversal pattern.
The second candle should have a short or non-existent lower wick, and the third candle should have little to no wick at all. A technical trader may treat the Three Black Crows as an opportunity to open a short position, aiming to profit from the downtrend that follows.
Three Inside Up:
The Three Inside Up pattern is another trend-reversal indicator. It appears after a downtrend and signals the start of an upward reversal. The three candles in a Three Inside Up are:
- A large red candle continuing the prior downtrend.
- A green candle whose body closes at least halfway up the previous candle, meaning the market has recovered half of its recent losses.
- A green candle that closes above the high of the first candle.
Buyers must have overpowered sellers for this pattern to appear, which halts the market’s decline and may kick off a new uptrend.
Three Inside Down:
The Three Inside Down pattern consists of a long green candle, followed by a red candle that closes at least halfway down the previous candle, and then another red candle that closes below the low set by the first candle.
When the Three Inside Down pattern appears after a rising market, traders watching for patterns may see it as an opportunity for a profitable short trade.
Three Outside Up:
The Three Outside Up pattern is a reversal pattern made up of three candles that appear on the chart in a specific sequence. It signals that the current trend has lost momentum and a reversal may follow.
This pattern is made up of three candles as follows:
The first candle is a down candle with a small body.
The second candle opens below the first candle and closes above it as well.
The third candle is an up candle that closes above the high of the second candle.
This pattern most often appears in support zones, turning the downward wave into an upward one.
This pattern can be traded as soon as it appears in a support zone during a downtrend: a buy trade can be executed once the pattern completes, with a stop-loss placed below the pattern and targets set at a 3:1 ratio.
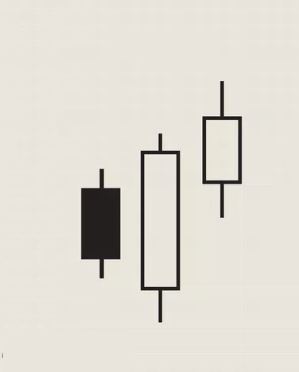
It’s best to combine this pattern with other technical analysis tools.
Three Outside Down:
This pattern is no different from the previous one: it’s a reversal pattern made up of three candles that must appear in a specific sequence, and it signals that the current trend has lost momentum with a reversal likely.
This pattern is made up of three candles, as follows:
- The first candle is an up candle with a small body.
- The second candle engulfs the first — it opens above it and closes above it too — showing sellers have entered the market forcefully and the odds of a decline now outweigh the odds of a rise.
- The third candle opens in the middle of the second and closes below it, confirming that sellers have taken control of the trend and successfully turned it in their favor.
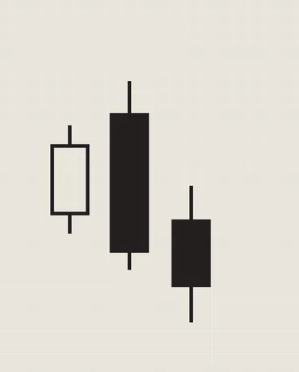
You can enter a sell trade as soon as the pattern is complete, with the stop-loss above the pattern and the target set at a 3:1 ratio. Keep in mind that candlestick patterns need additional confirmation, such as technical indicators or other technical analysis tools.
Japanese Candlestick Summary:
In the end, Japanese candlestick patterns are among the most advanced types of price charts, and the best candlestick pattern is arguably the Doji in its various forms. But remember, dear reader: candlesticks shouldn’t be used on their own — they need to be combined with other analysis methods, such as support and resistance or other tools.
- Japanese candlestick charts let you analyze price action at a glance.
- Technical traders may use them to identify trends, reversals, and upcoming trades.
- There are three main categories of patterns: single-candle, two-candle, and three-candle.
What do the wicks on Japanese candlesticks mean?
Wicks on Japanese candlesticks point to weakness in the trend. When wicks repeatedly appear above the candle body, it signals weakness in an uptrend; when they repeatedly appear below the body, it signals weakness in a downtrend.
How many Japanese candlestick patterns are there?
When it comes to the number of candlestick patterns, there are more than 60 recognized patterns. However, only a handful of them show up repeatedly on charts, such as the Hammer, the Shooting Star, and the Engulfing pattern.
What does a Doji candle indicate?
A Doji candle doesn’t necessarily point to a reversal or a correction in the market — it can also be classed as a neutral candle.
Who invented Japanese candlesticks?
Japanese candlesticks were created around the year 1600 by a Japanese trader named Homma Munehisa, and they were first applied to rice prices.
Read more:
- Japanese Candlestick Patterns | The 14 Most Famous Trend-Reversal Patterns
- Using Price Action on the Candlestick Chart the Right Way
Test this indicator without risking capital
Reading about an indicator is not the same as watching it behave on a live chart. A demo account lets you apply the settings above to real market data and see how the signals form before any money is involved.
Advertising disclosure: partner link. Easy Trade may receive compensation. Educational content, not financial advice. CFDs carry a high risk of losing your capital.
Disclaimer
This article is for educational purposes only and does not constitute investment or trading advice. Trading CFDs and other leveraged products carries a high level of risk and may not be suitable for all investors — you can lose more than your initial deposit. Some links on this page may be affiliate links, which means we may earn a commission if you sign up through them, at no extra cost to you.