
Daily High Low Indicator Explained

This indicator plots the previous day’s high and low on MetaTrader. It’s useful if you want to see the previous day’s highest and lowest price shown right on the chart. See also our guide to Daily Pivot Point Indicator.
Once you add the indicator to your chart, it looks like the image below:
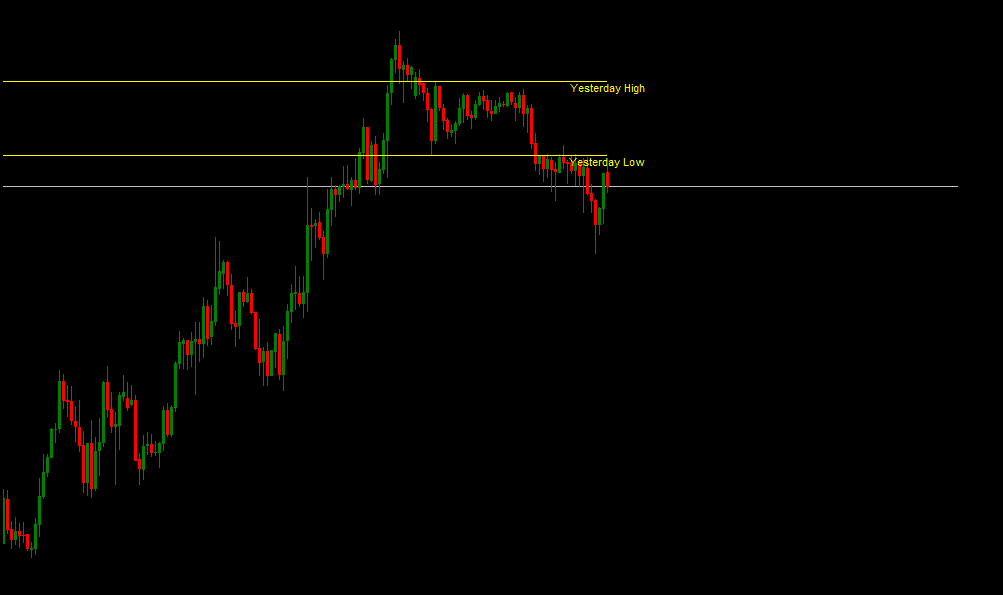
Once you load the indicator onto your chart:
What you’ll see are two lines, labeled the previous day’s high and the previous day’s low.
The Daily High/Low indicator reinforces the signals from a moving average and the Stochastic indicator to identify potential price reversals. It signals when price is near a bottom or a top, and this indicator isn’t widely available on charting platforms.
Key points of the Daily High/Low indicator:
- The Daily High/Low indicator combines a demand indicator with the Stochastic indicator.
- When the NHP line in the Daily High/Low indicator moves above three, it signals a possible top forming within the next four to six periods.
- When the Daily High/Low indicator moves below negative three, it signals a possible price bottom forming within the next four to six periods.
Explaining the Daily High/Low indicator:
The Daily High/Low indicator draws on the Demand Index and the Stochastic indicator to identify potential price reversals. The Demand Index is a complex oscillator that combines price and volume to give traders a strong signal, while the Stochastic indicator is commonly used as a momentum indicator to assess trend strength. Combining the two aims to measure both direction and momentum.
The Daily High/Low indicator also plots a high line (NHP) and a low line (NLP) that traders watch for moves above and below the daily levels, as well as crossovers that can signal a shift in the prevailing trend.
Generally, the high line dropping below negative three is taken as a sign that a new bottom will form within the next four to six periods. Likewise, the NHP line crossing below negative three signals that a new top may form within the same time frame.

Once a signal appears, traders may choose to wait for price confirmation before acting. For example, when the NLP drops below negative three, a trader can wait for both price and NLP to start moving back up before opening a buy position in the underlying asset.
Some traders believe the Daily High/Low indicator works better on weekly and monthly price charts than on short-term charts.
Traders should use the Daily High/Low indicator together with other technical indicators and chart patterns to improve their odds of success. For example, many traders will also look at additional momentum indicators or look for reversal patterns on the price chart as a sign that a short-term reversal may be developing.
Difference between the Daily High/Low indicator and MACD:
MACD measures the distance between two moving averages based on price, while the Daily High/Low indicator measures price and volume movement and also provides overbought/oversold readings. MACD doesn’t provide overbought or oversold readings, but it does give clues about the direction and strength of the price trend.
Conditions for using the Daily High/Low indicator:
This indicator isn’t widely used, so it isn’t available on most trading platforms and charting packages. The Daily High/Low indicator doesn’t always mark a bottom or a top correctly, which is why traders need other confirming indicators or analysis.
A bearish signal can appear, but price may keep falling for a long time. For example, a price reversal can happen without the indicator ever reaching three for a top or negative three for a bottom.
Test this indicator without risking capital
Reading about an indicator is not the same as watching it behave on a live chart. A demo account lets you apply the settings above to real market data and see how the signals form before any money is involved.
Advertising disclosure: partner link. Easy Trade may receive compensation. Educational content, not financial advice. CFDs carry a high risk of losing your capital.
Disclaimer
This article is educational only and is not investment advice. Trading CFDs carries a high level of risk to your capital and may not be suitable for all investors; you can lose more than your initial deposit. Some links on this page may be affiliate links, meaning EasyTradeWeb may earn a commission if you open an account through them, at no extra cost to you.