
Elliott Wave Complex Corrections: Double Three, Triple Three

The classic definition of complex correction rules in Elliott waves is that these are waves that move against the trend to a greater degree. Complex correction rules in Elliott Wave theory show much greater variety and are harder to identify clearly compared with impulse waves.
Sometimes it can be hard to identify corrective patterns until they are complete. Even so, as explained above, both the trend and the counter-trend can unfold within a corrective pattern in the markets, especially in the forex market. Complex correction rules in Elliott Wave theory are perhaps best defined as waves that move in three swings rather than five, the way impulse waves do. There are five types of complex correction rules in Elliott Wave theory:
Test this indicator without risking capital
Reading about an indicator is not the same as watching it behave on a live chart. A demo account lets you apply the settings above to real market data and see how the signals form before any money is involved.
Advertising disclosure: partner link. Easy Trade may receive compensation. Educational content, not financial advice. CFDs carry a high risk of losing your capital.
1. Zigzag (5-3-5)

Key points of the zigzag complex correction rules:
- Zigzag is a 3-wave corrective structure called ABC
- The A and C waves subdivide into 5 waves, either impulse or diagonal
- Wave B can take any corrective structure
- Zigzag is a 5-3-5 wave structure
Fibonacci ratio relationship for the zigzag complex correction:
- Wave B = 50%, or 61.8%, or 76.4%, or 85.4% of wave A
- Wave C = 61.8%, or 100%, or 123.6% of wave A
- If wave C = 161.8% of wave A, wave C can be wave 3 of a 5-wave impulse, so one way to tell an ABC apart from an impulse is whether the third wave has an extension.
2. Flat (3-3-5)
A flat correction is a 3-wave corrective move called ABC. Although the labeling is the same, flat corrective waves differ from zigzags in how wave A subdivides: a zigzag has a 5-3-5 structure, while in a flat wave A has a 3-3-5 structure. There are three different types of flat corrective waves: regular, double three and triple.
For regular flat corrective waves, the key points of the regular flat complex correction rules are as follows:
- It is a corrective move made up of 3 waves called ABC
- Waves A and B subdivide into 3 waves
- Wave C subdivides into 5 sideways impulse waves
- Waves A and B can subdivide into any 3-wave corrective structure, including zigzag, flat, double three and triple sideways
- Wave B ends near the start of wave A
- Wave C generally ends slightly beyond the end of wave A
- Wave C needs a divergence in momentum
Fibonacci ratio relationship for the regular flat complex correction:
- Wave B = 90% of wave A
- Wave C = 61.8%, or 100%, or 123.6% of wave AB
For double-three flat corrective waves, the key points of the double-three flat complex correction rules are as follows:
- A corrective move made up of 3 waves called ABC
- Waves A and B subdivide into 3 waves
- Wave C subdivides into 5 impulse waves
- Waves A and B can subdivide into any 3-wave corrective structure, including zigzag, flat, double three and triple
- Wave B of the 3-3-5 pattern ends beyond the starting level of wave A
- Wave C ends significantly beyond the final level of wave A
- Wave C needs a divergence in momentum size
Fibonacci ratio relationship for the double-three flat complex correction:
- Wave B = 123.6% of wave A
- Wave C = 123.6%-161.8% of wave AB
As for triple flat corrective waves, the key points of the triple flat complex correction rules are as follows:
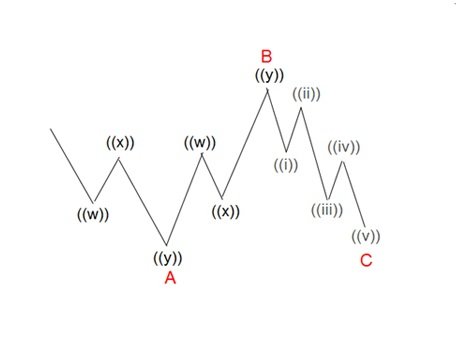
- It is a corrective move made up of 3 waves called ABC
- Waves A and B subdivide into 3 waves
- Wave C subdivides into 5 sideways impulse waves
- Waves A and B can subdivide into any 3-wave corrective structure, including zigzag, flat, double three and triple
- Wave B of the 3-3-5 pattern ends substantially beyond the starting level of wave A, as with the double-three flat corrective wave
- Wave C fails to complete, ending below the level where wave A ended
- Wave C needs a divergence in momentum size
Fibonacci ratio relationship for the triple flat complex correction:
- Wave B = 123.6% of wave A
- Wave C = 61.8%-100% of wave AB
3. Triangle (3-3-3-3-3)
A triangle is a sideways move tied to declining volume and price volatility. Triangle corrective waves have 5 legs, and each leg subdivides into 3 waves, forming a 3-3-3-3-3 structure. There are 4 types of triangles in Elliott Wave theory: ascending, descending, contracting and expanding, shown in the chart below:

For triangle corrective waves, the key points of the complex correction rules are as follows:
- The corrective structure is called ABCDE
- The triangle usually occurs in wave B or wave 4
- It is divided into three triangles (3-3-3-3-3)
- Confirming it also needs the Relative Strength Index to support the triangle on every timeframe
- The ABCDE subdivision can be either abc, wxy, or flat
In the case of the three-triangles corrective wave, it is a sideways combination of two of the corrective patterns explained above — among the many corrective patterns, including zigzag, flat and triangle. When two of these corrective patterns are combined, the result is what is called here a three-triangles pattern, summarized as follows:
- It is a combination of two corrective structures called WXY
- Wave W and wave Y can subdivide into a zigzag, a flat, a lesser-degree double three, or a lesser-degree triple
- Wave X can take any corrective form
- WXY is a 7-swing structure
Fibonacci ratio relationship for the three-triangles complex correction:
- Wave X = 50%, or 61.8%, or 76.4%, or 85.4% of wave W
- Wave Y = 61.8%, or 100%, or 123.6% of wave W
- Wave Y cannot exceed 161.8% of wave W

Below are examples of different combinations of two corrective shapes that form the double three-triangles pattern:

The shape above is a combination of a flat corrective wave and a zigzag.

The shape above is a combination of a flat corrective wave and a triangle.

The shape above is a combination of two lesser-degree double pairs of corrective waves. The triple corrective wave, meanwhile, is a sideways combination of three corrective patterns in Elliott Wave theory. The key points of its complex correction rules are as follows:
- It is a combination of three corrective structures called WXYXZ
- Wave W, wave Y and wave Z can subdivide into a zigzag, a flat, a lesser-degree double-three triangle, or a lesser-degree triple
- Wave X can take any corrective form
- WXYZ is an 11-swing structure
Fibonacci Ratio Relationship for Complex Correction Rules in Elliott Wave Theory
- Wave X = 50%, or 61.8%, or 76.4%, or 85.4% of wave W
- Wave Z = 61.8%, or 100%, or 123.6% of wave W
- Wave Y cannot exceed 161.8% of wave W, or it can turn into a three-wave impulse move. Below are examples of different combinations of corrective structures that form triples:

The shape above is a combination of a flat corrective wave, a double-three, and a zigzag.

The shape above is a combination of three double-three patterns.
Finally, Elliott Wave theory is named after Ralph Nelson Elliott (July 28, 1871 – January 15, 1948), an American accountant and author.
Complex correction rules were inspired by Dow Theory and by observations found throughout nature, and Elliott concluded that stock market movement could be estimated by observing and identifying a repeating pattern of waves.
Elliott was able to analyze markets in greater depth and identify the specific characteristics of complex correction patterns, producing detailed market outlooks based on the waves and their different patterns.
Elliott also based part of his work on Dow Theory, which likewise defines price movement in terms of waves, but Elliott discovered the fractal nature of market movement. Elliott first published his theory of market patterns in a book titled “The Wave Principle” in 1938.
Put simply, movement with the trend under Elliott wave rules unfolds in 5 waves called the impulse wave, while any correction against the trend — the complex correction rules — unfolds in three waves called the corrective wave.
Ideally, under complex correction rules, smaller patterns can be identified within larger patterns. In this sense, Elliott waves appear such that a smaller piece, if separated from the larger piece, resembles the larger piece.
This information about how smaller patterns fit inside larger patterns, together with the Fibonacci wave relationships, gives traders a framework for anticipating possible turning points when looking for and defining trading opportunities and assessing their risk-to-reward setups.
FAQ
What are the types of wave analysis?
There are many types of wave analysis, but the most important and best known is Elliott Wave theory, a technical analysis toolkit used to estimate price movements by observing and identifying repeating wave patterns.
How do you draw Elliott waves?
Project a parallel line from the end of wave 2. There is a chance the wave 4 correction ends when it reaches this projected trendline. Then project the end of wave 5: draw a trendline from the start of wave 3 to the end of wave 4, then project a parallel line from the end of wave 3.
What is Elliott wave analysis?
Elliott Wave theory is a form of technical analysis that looks for long-term recurring price patterns tied to the ongoing shifts in investor sentiment and psychology. The theory identifies impulse waves that form a pattern, and corrective waves that move against the larger trend.
How many Elliott waves are there?
Elliott Wave theory is interpreted as follows: five waves move in the direction of the main trend, followed by three waves in a correction, for a total movement of 5 to 3 waves.
Disclaimer: This article is for educational purposes only and does not constitute investment advice or a recommendation to buy or sell any financial instrument. Elliott Wave analysis is a subjective technical method and does not guarantee future price movement. Trading CFDs and leveraged products carries a high level of risk and can result in losses that exceed your deposited capital; most retail investor accounts lose money when trading CFDs. This page may contain affiliate links, meaning we may earn a commission if you sign up with a broker through one of our links, at no extra cost to you. Always do your own research and consider seeking independent financial advice before trading.