
Three Drives Pattern: Four Rule Sets, One Fibonacci Ladder

The three drives pattern is a five-point count that claims to mark the end of a trend after three pushes in the same direction. Four of the pages that publish rules for it do not agree on what those rules are.
They disagree on which Fibonacci ratios define the drives, on whether the third drive has to travel further than the second, and on whether the drives have to take a similar amount of time. None of them mentions that a competing version exists.
What follows sorts the published levels back into the single sequence they come from, identifies the one level in circulation that does not belong to that sequence, and sets out which convention you are working under once a charting tool draws the count for you.
Key takeaways
- The count is read on five points: a first drive, a counter-move, a second drive, a second counter-move, and a third drive.
- The ratios published for it – 38.2, 61.8, 78.6, 113, 127.2 and 161.8 per cent – are powers and roots of one number, 1.618034. That single number reproduces every level on every published list.
- 50 per cent appears on one published list of Fibonacci retracements for this pattern. It cannot be produced from 1.618034 by any power or root.
- One published rule set completes the third drive at 78.6 or 100 per cent of the second. Three others require the third drive to travel further than the second, so the two sets describe different shapes under one name.
- Two of the four descriptions make similar timing a condition. A platform recognition rule for the same pattern states none.
- Not one of the four cites anything outside itself for its ratios, and none states a failure rate or a sample.
Table of contents
- What a Three Drives Count Claims to Mark
- The Ratios Are One Ladder, and 50 Per Cent Is Not On It
- Four Sources, Four Rule Sets
- An Extension Below 100 Per Cent Is Not an Extension
- Timing: Two Definitions Require It, One Recognition Rule Does Not
- Which Version You Find Is Decided by Your Chart Tool
- Which Convention Applies to You
What a Three Drives Count Claims to Mark
The shape is three pushes in one direction separated by two counter-moves. Label the turning points and you have five of them, which is why the count belongs to the same family as the harmonic pattern family rather than to the two-point and three-point patterns read off a trend line.
The claim attached to it is exhaustion. Three pushes have happened, each one measured against the last, and the count says the third is the final one. That is a claim about the end of a move, not about its continuation, and it is what separates this count from a channel or a wedge that simply describes where price has been travelling.
The five-point structure is shared with other counts. Another five-point count uses the same number of turning points to project a target rather than to mark exhaustion, so the point count alone identifies nothing. What identifies this one is the set of ratios the drives and the counter-moves are required to hit, and that is where the published descriptions stop agreeing with each other.
The Ratios Are One Ladder, and 50 Per Cent Is Not On It
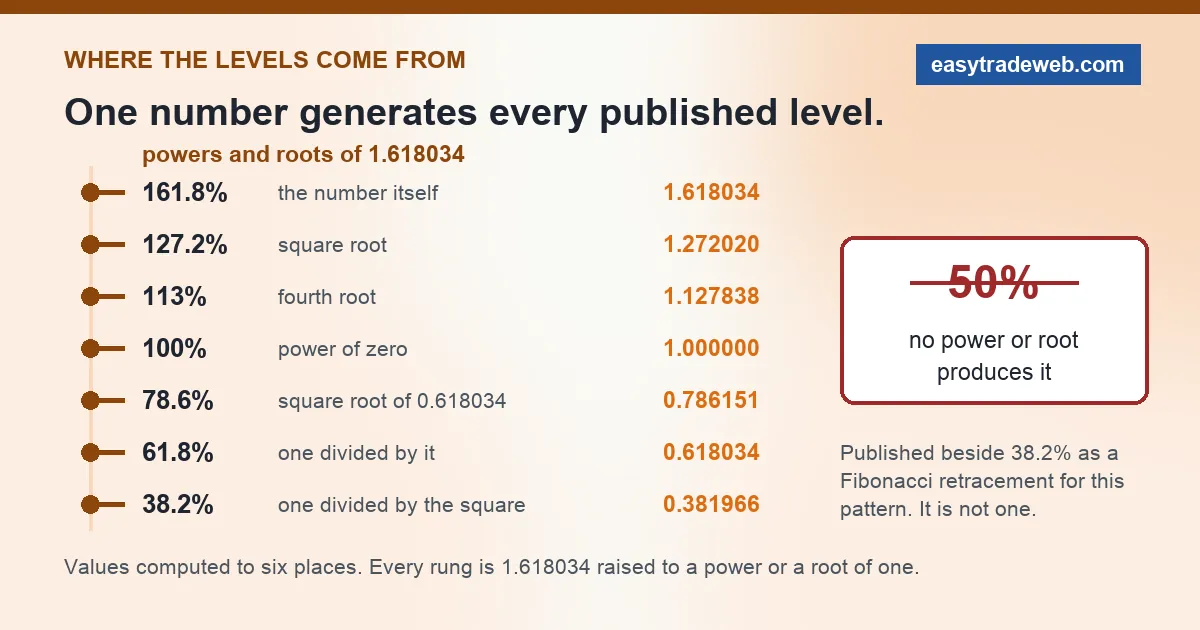
Every level in circulation for this pattern comes from one number. Write it as 1.618034 and the whole list falls out of it by taking powers and roots.
Divide one by it and you get 0.618034, printed as 61.8 per cent. Divide one by its square and you get 0.381966, printed as 38.2. Take the square root of 0.618034 and you get 0.786151, printed as 78.6. On the other side of one, the square root of 1.618034 is 1.272020, printed as 127.2, and the fourth root is 1.127838, which is where the 113 on one publisher list comes from.
So a reader who is asked to memorise four different lists is being asked to memorise four selections from one ladder. Knowing the generator is more useful than knowing any one list, because it tells you what a level between two published values would be, and it tells you immediately when a level is not on the ladder at all.
One of them is not. 50 per cent appears on a published list of Fibonacci retracements for this pattern, beside 38.2. There is no power or root of 1.618034 that produces 0.5: the exponent required is minus 1.4404, which is neither a whole number nor a half.
The halfway retracement has a long history in charting and it is used for reasons of its own, but it is not a Fibonacci ratio and it does not belong on a list headed by one. The same applies to 100 per cent, which is 1.618034 raised to the power zero and therefore just equality – a drive that matched the one before it, not an extension of it.
| Published level | Expression in 1.618034 | Computed value |
|---|---|---|
| 38.2% | one divided by the square | 0.381966 |
| 50% | no power or root produces it | 0.500000 |
| 61.8% | one divided by it | 0.618034 |
| 78.6% | square root of 0.618034 | 0.786151 |
| 100% | raised to the power zero | 1.000000 |
| 113% | fourth root | 1.127838 |
| 127.2% | square root | 1.272020 |
| 161.8% | the number itself | 1.618034 |
Four Sources, Four Rule Sets
Four descriptions of this pattern were readable when this page was written: the site of the trader who named it, the help documentation for a charting platform drawing tool, the pattern reference for a broker platform, and a broker education article. Set their rules side by side and the four are not describing one thing.
The differences are not rounding. Where one requires the third drive to reach at least 113 per cent of the second, another accepts 78.6. Where one makes similar timing a condition of the count, another states no timing condition at all. And where the retracement ratios come from is stated by none of them: the numbers appear as rules, without derivation and without a citation to anything outside the publisher’s own material.

The pattern of who drops what is worth noticing. The two rules that survive everywhere are the two that can be written as a ratio between two price distances, because those are the two a piece of software can evaluate.
The conditions that get dropped are the ones that resist being coded: how equal the time has to be, how much gap in the price track is too much, how tidy the shape has to look before a human would accept it. A tool has to answer yes or no, so a condition that only a person can judge tends not to reach the tool at all.
None of the four reports a test of any kind. There is no sample of past instances, no count of how often a marked pattern was followed by the reversal it claims to mark, and no figure of any sort that is presented with a method behind it. That is not an oversight peculiar to this pattern, but it does mean the strictness of a rule set here cannot be defended by results, only asserted.
| Publisher type | Counter-move levels | Drive levels | Timing condition |
|---|---|---|---|
| The originating trader’s own site | Not stated | 113, 127 or 161.8 | Yes, equivalent periods per drive |
| Charting platform drawing tool | 61.8 or 78.6; 38.2 or 50 when trending strongly | 127.2 or 161.8 | Yes, in price and in time |
| Broker platform pattern reference | About 61.8 | About 127.2 | None stated |
| Broker education article | 38.2 to 61.8 | 78.6, 100 and 161.8 | Symmetry named as a principle |
An Extension Below 100 Per Cent Is Not an Extension
The row that does not fit is the last one. A drive that finishes at 78.6 per cent of the drive before it is shorter than that drive. A drive that finishes at 100 per cent is the same length. Neither one extends anything, and both are excluded by the minimum of 113 per cent that the originating description sets.
This is not a disagreement about how strict to be. It is a disagreement about which way the third push has to go relative to the second, and it produces two different pictures on a chart. Under one rule set the three drives get progressively larger and the count is a picture of acceleration into exhaustion. Under the other the third drive can be the smallest of the three, and the count is a picture of a move running out of force.
Both pictures might be worth something. What is not worth anything is applying the entry logic written for one to a shape found by the other, which is what happens whenever a reader takes the levels from one page and the method from another. Neither page tells you the other exists.
Timing: Two Definitions Require It, One Recognition Rule Does Not
The originating description makes timing part of the pattern: each drive is expected to form over an equivalent period, so a first drive that takes twenty bars and a third that takes four are not the same count even if every price ratio lands. The charting platform guidance goes further and treats a formation that is not symmetrical enough, or that contains gaps, as one to abandon rather than to trade.
The broker platform reference states its recognition rule entirely in prices. Two counter-moves near 61.8 per cent and a final leg near 127.2 per cent, and the pattern is recognised. There is no timing test, which means the same software will mark a count where the three drives took wildly different amounts of time – a count the originating definition would reject on sight.
The practical consequence runs one way. A price-only rule is looser, so it finds more instances, and a reader who has been told the pattern is rare will find it common. It is the same effect that turns the ABCD count from a demanding structure into a shape visible on any chart once the tolerance around each leg is widened.
Which Version You Find Is Decided by Your Chart Tool
Almost nobody measures these ratios by hand. The count arrives on the chart through a drawing tool or a pattern scanner, and that software carries its own defaults for every level in the set. Those defaults are the convention you are trading, whether or not you chose it.
That is worth checking before a count is treated as valid, and it takes one look at the tool’s settings. If the counter-move level is set to 61.8 and the drive level to 127.2, the count on your screen was produced by the narrowest of the four rule sets above. If the drive level accepts 78.6, the tool will mark shapes that three of the four descriptions do not consider this pattern at all.
The same caution applies to a scanner list. A pattern recognition feature that returns a dozen instances in a session is enforcing a looser rule than one that returns a dozen in a year, and the difference is a settings choice rather than a market condition. It sits alongside the wider problem of what a plotted study is actually measuring, which is the reason the Gartley count also varies between the tools that draw it.
Which Convention Applies to You
If you are working from the originating definition, two conditions bind: the third drive has to travel further than the second, by at least 113 per cent of it, and the drives have to take roughly equal time. If you are working from a platform scanner, only the price ratios are being enforced and the timing check is yours to add.
If the levels in front of you include 78.6 or 100 per cent as drive targets, you are reading about a shape the other three descriptions exclude, and the entry and invalidation rules from those descriptions do not carry across to it.
Risk notice. This page is educational. It compares how published descriptions of one chart pattern differ from each other and checks the arithmetic behind the levels they state. Nothing here is a recommendation to buy or sell any instrument, no move described is a forecast, and no expected result is stated or implied. Leveraged trading carries a high risk of loss.