
Heikin-Ashi Candles: How to Read Single and Double Shadows

Heikin-Ashi candles — sometimes spelled Heiken-Ashi — are one of the chart types many traders overlook, assuming there are only three kinds available: line charts, bar charts, and Japanese candlesticks. In reality, trading platforms such as MetaTrader and TradingView offer many more chart types, and Heikin-Ashi candles are one of them. So what is Heikin-Ashi? How is it different from Japanese candlesticks? And how do you read it? We’ll answer all of these questions in detail. Related reading: Tweezer Candlestick Pattern.
What Is Heikin-Ashi?
The Heikin-Ashi technique was developed in the 18th century by a Japanese trader named Munehisa Homma. Looking at the Japanese meaning of the words, “Heikin” means “average” and “Ashi” means “pace.” So “Heikin-Ashi” means “average pace chart.”
Heikin-Ashi is a trading technique that calculates the average of price movement and displays it in the form of candles; it helps traders filter out market noise.
How to Add Heikin-Ashi Candles to Your Trading Platform
You don’t need to load any extra indicators to add Heikin-Ashi candles to your trading platform — most platforms offer this built in. On MetaTrader, just follow these steps:
Insert > Indicators > Custom > Heiken-Ashi
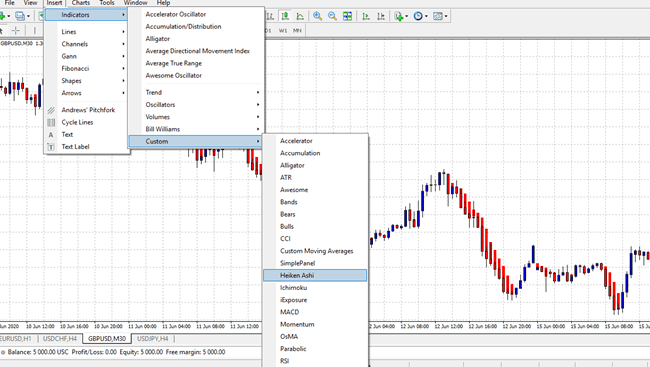
Adding Heikin-Ashi candles — as shown in the image above.
If your platform interface is set to Arabic, the same path reads: إدخال > مؤشرات > مخصص > Heiken-Ashi
After that, you can change the candle color from this menu:
Heikin-Ashi candle color settings.
In the end, it will look like this:
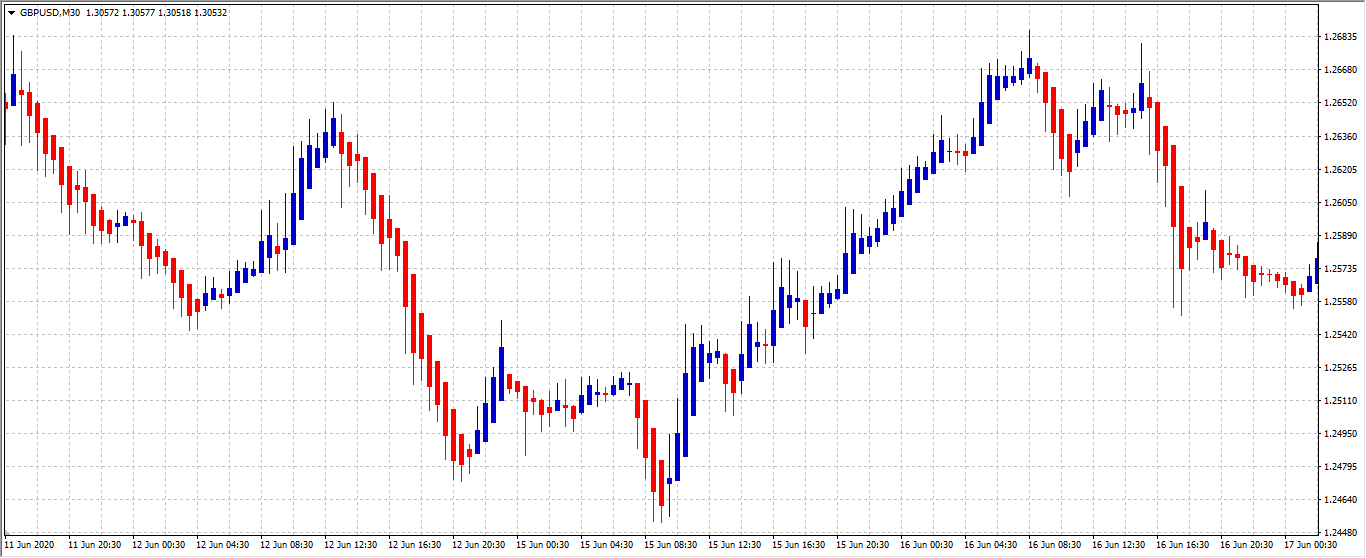
The final shape of Heikin-Ashi candles.
How to Read Heikin-Ashi Candles
There are two types of Heikin-Ashi candles:
- Single-shadow
- Double-shadow
Single-shadow candles: these are trend candles that signal a continuation of the trend, with a shadow (wick) on only one side — top or bottom. Look at the image below:
Types of Heikin-Ashi candles.
The image above shows single-shadow candles — one in an uptrend and the other in a downtrend.
Double-shadow candles: these are reversal candles that signal a change in trend direction, with a shadow on both the top and the bottom. Look at the image below.
A double-shadow Heikin-Ashi candle.
You’ll notice in the image above that the trend was rising, and after a double-shadow candle appeared, the trend reversed to falling.
What’s the Difference Between Heikin-Ashi and Japanese Candlesticks?
Heikin-Ashi candles don’t look very different from Japanese candlesticks — both have a body and a wick — but what sets them apart is that their wicks point in one direction only. They also differ in how price movement is calculated: Heikin-Ashi candles calculate the average of price movement, while Japanese candlesticks display price movement directly, without any averaging calculation. Look at the two images below:
Heikin-Ashi candles.

Heikin-Ashi candles.
The first image is the Heikin-Ashi candle chart, and the second is the traditional Japanese candlestick chart.
- As you can see from the first chart, directional moves are smoothed out and are clearer than on the second chart.
- Candles on the traditional chart often flip from blue to red (up or down), which can make them harder to read. On the other hand, candles on the Heikin-Ashi chart show more consecutive candles of the same color, which helps traders identify price moves more easily.
- You’ll notice that Heikin-Ashi charts tend to keep their candles blue during an uptrend and red during a downtrend. This is in contrast to traditional Japanese candlesticks, which show a mix of both colors even when price is moving strongly in one direction.
Heikin-Ashi candles also differ from Japanese candlesticks in how they display the open and close: in Heikin-Ashi, a candle opens from the midpoint of the previous candle, unlike Japanese candlesticks, which open at the last closing level of the previous candle. Look at the image below:
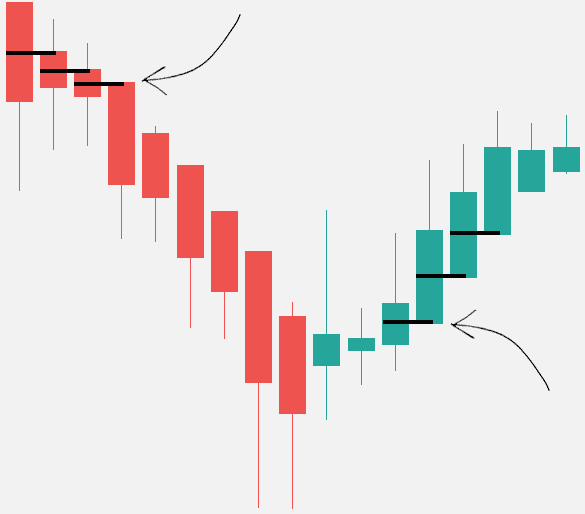
Heikin-Ashi candles.
You can clearly see that Heikin-Ashi looks smoother in how it displays price movement. This is why some traders prefer using Heikin-Ashi candles — because it reduces noise on the chart and allows them to analyze trends more clearly.
Conclusion
Heikin-Ashi is a trading technique that calculates the average of price movement and displays it in the form of candles; it helps traders filter out market noise.
There are two types of Heikin-Ashi candles:
- Single-shadow
- Double-shadow
Heikin-Ashi candles don’t look very different from Japanese candlesticks — both have a body and a wick — but what sets Heikin-Ashi apart is that its wicks point in one direction only. They also differ in how price movement is calculated: Heikin-Ashi candles calculate the average of price movement, while Japanese candlesticks display price movement directly, without any averaging calculation.
Test this indicator without risking capital
Reading about an indicator is not the same as watching it behave on a live chart. A demo account lets you apply the settings above to real market data and see how the signals form before any money is involved.
Advertising disclosure: partner link. Easy Trade may receive compensation. Educational content, not financial advice. CFDs carry a high risk of losing your capital.
Finally, Heikin-Ashi candles — sometimes spelled Heiken-Ashi — mean “average pace” in Japanese, and the technique can be used alongside Japanese candlestick charts when trading securities to spot market trends and forecast future prices.
Heikin-Ashi candles make Japanese candlestick charts easier to read and make trend analysis simpler, so traders can use Heikin-Ashi charts to know when to stay in a trade while a trend continues, but exit when the trend pauses or reverses, since trends can be forecast more accurately this way.
Frequently Asked Questions
What is a candle in forex trading?
Each candle represents a time period, and its data corresponds to the trades executed during that period. A candle contains four data points: open — the first trade during the period the candle covers; high — the highest price traded; low — the lowest price traded.
Who invented Japanese candlesticks?
Japanese candlesticks are a technical analysis tool that traders use to chart and analyze the price movement of securities. The concept of candlestick charting was developed by Munehisa Homma, a Japanese rice trader.
How do you read Japanese candlesticks?
To read Japanese candlestick patterns, you need to recognize three elements in each candle: its color, its body, and its wick. The color tells you the direction of movement during the period, the body shows the market’s open and close levels, and the wick shows the high or low of the range.
What are Heikin-Ashi candles?
Heikin-Ashi is a candlestick pattern and technique that aims to reduce some market noise, creating a chart that highlights the trend direction better than traditional candlestick charts. The downside of Heikin-Ashi is that some price data is lost through averaging, which can affect risk assessment.
Disclaimer: This article is for educational purposes only and does not constitute investment advice or a recommendation to buy or sell any financial instrument. Heikin-Ashi is a charting technique, not a guarantee of future price direction, and trading CFDs and forex carries a high level of risk due to leverage and can result in losses that exceed your deposit. This page may contain affiliate links; Easy Trade may earn a commission if you sign up through them, at no extra cost to you.