
Marubozu Candlestick Pattern

The Marubozu candlestick pattern is a single-candle bearish pattern, and it is a direct formation that is easy to spot, since there are three types of Marubozu candle: open, closed, and full. In all three cases, there are both bullish and bearish versions of this candle.
For a Marubozu candle to be classified as complete and correct, at least one side of the candle, the open or the close, must be flat.
In the full Marubozu shape, both the open and the close are fixed: the asset opens the session and starts moving in one direction, then closes at the end with no wicks on the candle at all. So the open and close sit at the same price as the high and the low.
For the open Marubozu candle, the opening price must be fixed, meaning price has to move in only one direction. But unlike the full Marubozu, the closing price can differ slightly from the high or low on the other side. In other words, the candle’s open must be flat, while there is a short wick on the other side.
The closed Marubozu candle is the opposite of the open Marubozu: the close must be flat, while price can move slightly in the other direction before trading pushes strongly in one direction.
What Does the Marubozu Candle Tell You?
The Marubozu candle sends a strong message that the market is moving in one direction. If the candle breaks the open or close levels of the candle before it, you can see the asset’s price trading in one direction for an extended period.
This property also applies to the open and closed Marubozu candles despite the small wicks on either side, because buying or selling interest was strong enough to dominate the other side of the market.
For bearish Marubozu candles, the pattern indicates that sellers are fully in control, having taken over the market in the desired direction, and the opposite is true for bullish Marubozu candles. The Marubozu candle is especially significant when it appears near resistance or support levels, since it can open on one side and close on the other, adding further weight to the current trend.
Read also: Gravestone Doji candle explained
How to Trade Using the Marubozu Candle Pattern:
On any chart, for any asset, you will be able to spot the Marubozu candle pattern in one of its forms. In the chart below, we have a USD/CAD chart where you can see an open bullish Marubozu candle.
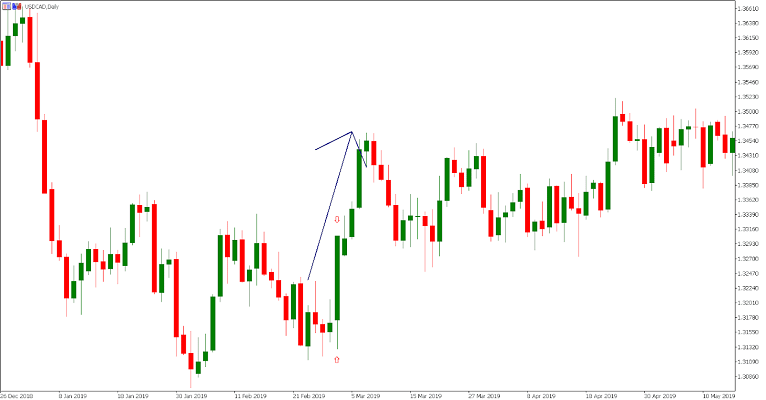
After the downtrend, price action consolidates through sideways trading. At some point, buyers take control of the upside by pushing price higher, eventually forming a candle where the open and the low sit at the same price, while the close and the high lead the way.
Here, the market is telling us the trend is now bullish, since buyers controlled price action from the open to the end of the candle. The uptrend then continued, eventually making a new short-term high.
Test this indicator without risking capital
Reading about an indicator is not the same as watching it behave on a live chart. A demo account lets you apply the settings above to real market data and see how the signals form before any money is involved.
Advertising disclosure: partner link. Easy Trade may receive compensation. Educational content, not financial advice. CFDs carry a high risk of losing your capital.
When trading the Marubozu, entry comes after the Marubozu candle closes. Setting take-profit and stop-loss levels is harder than with, say, the Hammer pattern, since this pattern typically produces strong one-sided candles that are easy to spot and interpret, but trade elements like take-profit and stop-loss are not as clear.
For example, the Hammer pattern gives you a clean low that can be used to set a stop-loss, while the Marubozu relies more heavily on other technical indicators to set stop-loss and take-profit levels.

So you can enter a buy trade right after a bullish Marubozu forms, since that signals the trend may continue, but you should use other tools and indicators to set your take-profit and stop-loss orders.
The previous example shows how the Marubozu candle pattern works: it signals that market sentiment is entirely one-sided at that moment. In this case, buyers pushed price higher without much resistance from sellers.
In the next example, we have the opposite situation: price action has reversed course and is now trading in a bearish environment. After two long red candles, a closed bearish Marubozu appears, indicating that sellers remain the dominant force.
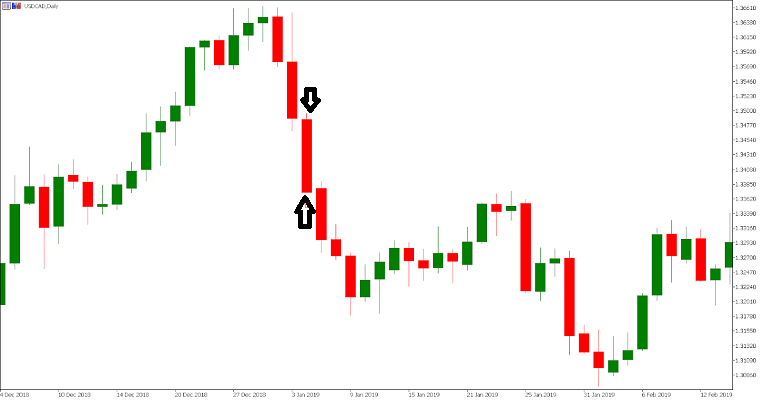
Price action then continues lower, as the market was strongly bearish during this period. The significance of the bearish Marubozu here is that it signaled the current downtrend was likely to continue, since buyers were not able to change the direction.
In both examples, the Marubozu candle only gave a signal about the likely future direction of price action, unlike reversal patterns, which carry stronger signals or warnings. The Marubozu is typically used only to confirm that price action may continue in the same direction.
For example, if you are short USD/CAD from the reversal point, a bearish Marubozu forming tells you to stay in the trade, since sellers are still in control of price.
Frequently Asked Questions:
What is a reversal candle?
A reversal candle pattern is a Japanese candlestick formation arranged in a way that signals the end of an existing trend in favor of the opposite direction.
What is the Marubozu candle?
Marubozu is a long-bodied candlestick with no shadow, derived from the Japanese word meaning “close-cropped.” Japanese candlestick charts look at the open and close price within a single day, and they are used by technical traders.
How do I read candlesticks?
To read Japanese candlestick patterns, you need to identify three elements on each candle: its color, its body, and its wick. The color tells you the direction of movement during the period, the body shows the market’s open and close levels, and the wick shows the high/low range.
What does a Doji candle indicate?
A Doji candle is a pattern used by technical stock traders as a signal that the stock’s price may soon go through a bearish reversal.
Disclaimer: This article is for educational purposes only and does not constitute investment advice. Candlestick patterns like the Marubozu are analytical tools, not guarantees of future price movement, and signals can fail. Trading CFDs and leveraged products carries a high level of risk and may not be suitable for all investors; you could lose more than your initial deposit. This page may contain affiliate links, meaning easytradeweb.com may earn a commission if you sign up through one of them, at no extra cost to you.