
What Is the VWAP Indicator?

The Volume Weighted Average Price (VWAP) indicator is unique in that it only applies to intraday charts — that is, timeframes shorter than a full day. It works best on 1-minute, 5-minute, 1-hour, and similar charts. Related reading: Liquidity Indicator.
Its calculation runs throughout the session and resets at the start of the next one. Because the formula factors in the cumulative volume recorded during the session, this alone means it cannot be calculated on daily or weekly data. The anchored variant removes that reset and hands the starting bar to the user instead.
How VWAP (Volume Weighted Average Price) Is Calculated
The VWAP indicator, which appears on the chart as a moving-average-style curve, is calculated in several steps:
1) For each price bar on the chart (for example, each 1-minute bar), we calculate the average price, also called the “typical price,” which equals:
(High + Low + Close) / 3
2) We multiply this average price by the volume of that period.
3) Throughout the session, we accumulate the result from step 2.
4) For each bar on the chart, the volumes of the current bar and all previous bars since the open are added together.
5) We get the “VWAP” by dividing the result of step 3 by the result of step 4.
The typical price used at step 1 is one way of summarising a bar rather than the only one; smoothed moving averages on the bar midpoint summarise it differently and weight past bars differently again.
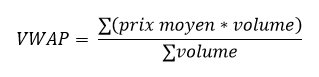
In the end, the formula looks like this:
VWAP Indicator Features
The chart below shows the EUR/USD pair on a 5-minute timeframe. The VWAP curve is plotted in pink, and its calculation takes into account each 5-minute bar along with its associated volume.
VWAP gives greater weight to prices where larger volumes were traded — that is the entire point of the weighting built into its calculation. The author of the formula considered these to be the key price points that deserve extra representation.
Using the VWAP Indicator in Trading
Just like moving averages, VWAP can be used the same way a trend indicator is used. The indicator has a fairly high lag, so it will not move erratically during the session, which lets you set stop or target levels.
It also shares an input choice with the Awesome Oscillator, since both reduce each bar to a representative price before any averaging is done.

The two examples below show a bullish session on Facebook stock and a bearish session on Technicolor:
Bullish Session
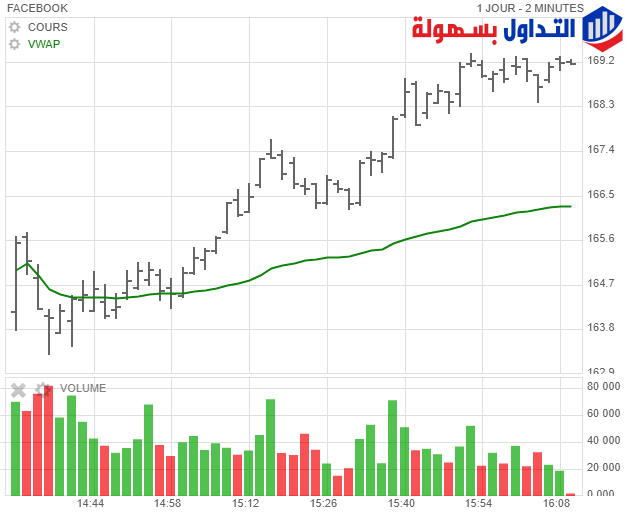
In this case, we see that VWAP spends most of its time below the price curve. It advances slowly and allows a bearish reversal point to be identified if prices were to break through it.
Bearish Session
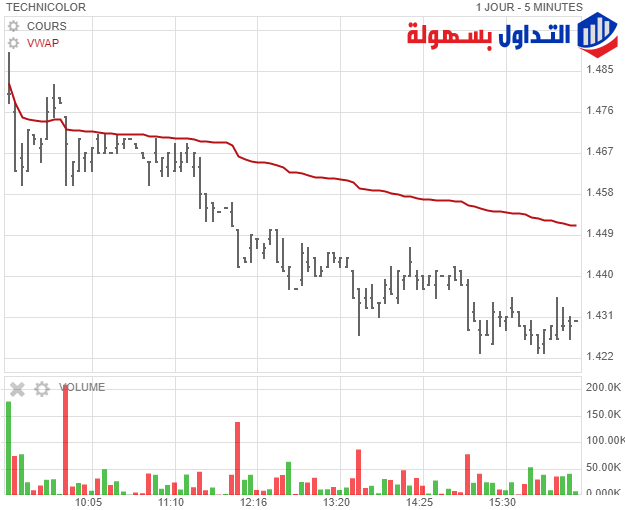
Here we observe the opposite phenomenon: price action is capped, and VWAP follows this trend. Those looking to buy can wait for prices to break above the indicator, which makes it possible to confirm a bullish reversal.
Conclusion
The VWAP indicator is useful for identifying price direction during a session. It quickly positions itself below or above the price and gives us the direction of the path.
However, like moving averages, if there is no trend, VWAP will be a flat line that does not provide much information. In addition, VWAP lags behind price, and that lag grows hour by hour because of how it is built, since the calculation includes all volume data since the open.
The fact remains that the indicator is interesting precisely because it factors in both price and volume in its calculation, which is uncommon in technical analysis.
Finally, while the VWAP indicator is relatively unknown to beginners, professionals use it regularly. Traders who execute very large trades by volume use it to manage their orders better and try to avoid moving the market when opening a position, keeping a low profile in the process. Algorithms also factor this in to improve order placement and reduce transaction costs.
In short, the VWAP indicator is a trading benchmark tool used by traders. It gives the average price at which a security has traded throughout the day, based on volume and price, and it matters because it gives traders a strong view of the direction and value of the traded asset.
Read also: Weighted Moving Average (WMA)
Test this indicator without risking capital
Reading about an indicator is not the same as watching it behave on a live chart. A demo account lets you apply the settings above to real market data and see how the signals form before any money is involved.
Advertising disclosure: partner link. Easy Trade may receive compensation. Educational content, not financial advice. CFDs carry a high risk of losing your capital.
Disclaimer: This article is for educational purposes only and does not constitute investment advice. VWAP is a technical tool that reflects past price and volume data; it does not guarantee future results, and signals derived from it can fail. Trading CFDs and leveraged products carries a high level of risk and may not be suitable for all investors — you can lose more than your initial deposit. This page may contain affiliate links; Easy Trade Web may earn a commission if you open an account through them, at no extra cost to you.