
What Is the RSI Indicator?

The RSI indicator, short for Relative Strength Index, is one of the most popular and widely used technical analysis indicators. It shows the current state of the market in terms of overbought and oversold conditions, and it can also measure momentum. This article explains the RSI indicator and how to use it.
RSI Indicator Definition
The RSI is a momentum indicator developed by technical analyst Welles Wilder. It calculates the ratio of upward price changes to downward price changes over a given time period, for each unit of time. That single lookback is the plainest difference between it and oscillators that use more than one lookback.
The term “Relative Strength Index” is abbreviated as RSI.
The RSI indicator is similar to the Stochastic indicator in that it also shows the current state of the market in terms of overbought and oversold conditions.
It is also similar in that it is scaled from 0 to 100.
Readings of 30 or below usually indicate an oversold condition, which increases the likelihood that prices will rise. In contrast, the region from 70 and above indicates an overbought condition, which increases the likelihood that prices will fall.
Read also: RSI Indicator and Buy/Sell Signals
How to Add the RSI Indicator to MetaTrader
The good news is that you do not need to download the RSI indicator. Just follow the steps shown in the image below.
Explaining the RSI Indicator
We will now look at the main uses of the RSI indicator. Before starting, note that the best RSI settings are the default settings. The indicator’s uses include the following:
Identifying Whether a Move Is a Correction or a Reversal
Besides using the RSI indicator to identify overbought and oversold market conditions, it can also be used to identify market direction. When the indicator value is below the 50 level, this points to a downtrend, and when the indicator value is above 50, this points to an uptrend.
Look at the following chart.

In the chart above, price was in an uptrend, then began to correct, and when the indicator value reached 50, the uptrend resumed.

Predicting the End of the Current Move
The most common way to use the RSI indicator in trading is to anticipate the end of a move. When the indicator value falls below 30, the price has reached an oversold condition and the trend may reverse upward. In contrast, when the indicator value rises above 70, the price has reached an overbought condition and the trend may reverse downward.
Look at the following chart.
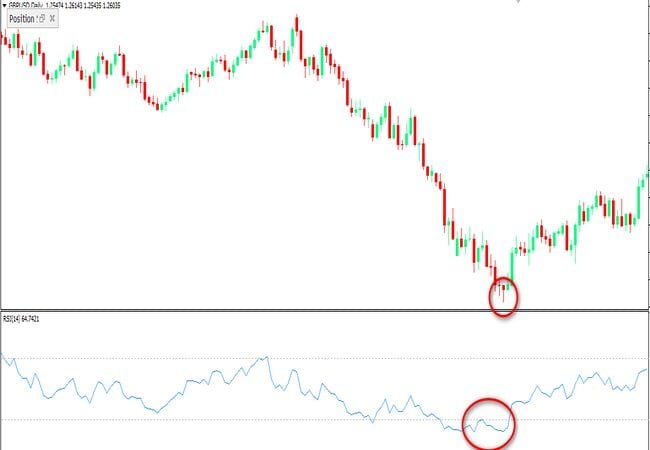
In the chart above, price was in a downtrend, and when the indicator value dropped below 30, it signaled that price had reached an oversold condition, which led to the price direction changing upward.
Measuring Momentum
Normally, the indicator follows price movement, but when a divergence occurs between price movement and the indicator, this signals that a new move may be forming or that the trend may be about to change. When price moves in the opposite direction to the indicator, it warns that the current price trend may be weakening, and in some cases this can lead to a change in price direction.
Look at the following chart.
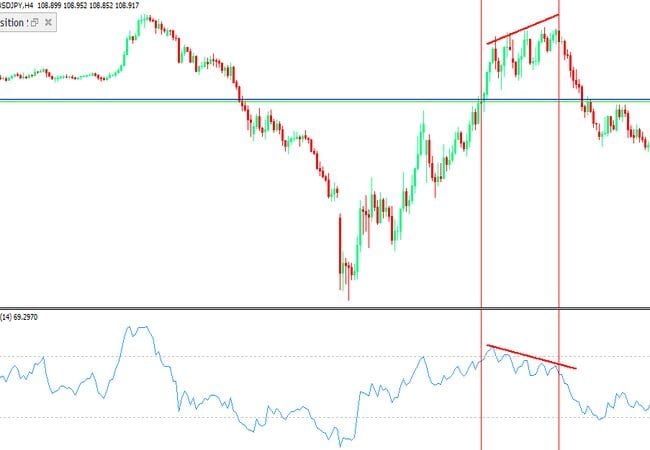
In the chart above, price was in an uptrend and the indicator was following it, but then a divergence occurred: price made a new high while the indicator made a new low. This is what is known as divergence, and it resulted in a change in the direction of the current move.
Conclusion
The RSI indicator is a momentum indicator used in technical analysis that measures the size of recent price changes to evaluate overbought or oversold conditions in the price of a stock or other asset. The RSI is displayed as an oscillator on a line chart and moves between two extremes, with readings ranging from 0 to 100.
The traditional interpretation and use of the RSI is that values of 70 or above indicate that a security has become overbought and may be primed for a trend reversal or a corrective pullback in price, while a reading of 30 or below indicates an oversold condition, and price may be close to a correction or reversal if:
- The RSI indicator is a very popular tool because it can be used to confirm the current trend.
- If you think a trend is forming, take a quick look at the RSI indicator and see whether it is above or below 50. If you are looking for a potential uptrend, make sure the RSI indicator is above 50; if you are looking for a potential downtrend, make sure the RSI indicator is below 50.
Test this indicator without risking capital
Reading about an indicator is not the same as watching it behave on a live chart. A demo account lets you apply the settings above to real market data and see how the signals form before any money is involved.
Advertising disclosure: partner link. Easy Trade may receive compensation. Educational content, not financial advice. CFDs carry a high risk of losing your capital.
Disclaimer: This article is for educational purposes only and does not constitute investment advice. Trading forex and CFDs involves leverage and carries a high level of risk to your capital, and may not be suitable for all investors. Past performance of any indicator or strategy is not a reliable guide to future results. This page may contain affiliate links; if you sign up through them, easytradeweb.com may earn a commission at no extra cost to you.