
Easiest Currency Trading Strategy

Many traders look for a simple currency trading strategy that anyone can follow, whatever their level. This article covers one of the more straightforward approaches, because it does not involve much complexity. See also our guide to Best Currency Trading Strategy.
The Easy Currency Trading Strategy
Strategy requirements
This strategy does not need many indicators or much experience in the forex market. All you need is support and resistance, which is one of the first things a trader learns in technical analysis and is not a difficult concept.
You then add any oscillator, such as the Stochastic, the Relative Strength Index (RSI), the CCI or similar indicators, keeping the default settings in place. The RSI is the one used in this walkthrough.
Read also: How to identify support and resistance using moving averages.
Timeframe used
The strategy can be applied across more than one timeframe, from the 5-minute up to the weekly chart, but it works better on smaller timeframes, such as the 15-minute chart used in this explanation.
How the strategy works
Now for the main part of this article: how the strategy works. We will break it into steps, so follow the explanation below.
1- Find the sideways trading range
The first step is to look for a sideways (range) zone on the chart, because this strategy is used mainly in sideways markets. When you see two equal highs and two equal lows, you can say a sideways move is forming that may last for some time. Look at the chart below.
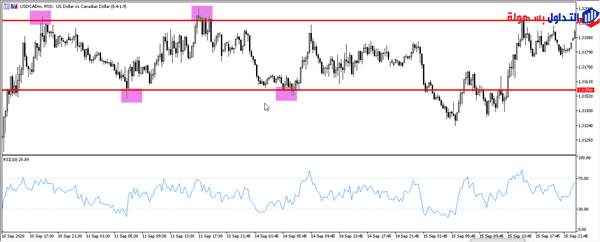
In the chart above, the price has formed two consecutive highs and two consecutive lows, so we can say we have a sideways range.
2- Draw the support and resistance zones
After identifying the sideways range, draw support and resistance on the highs and lows that have formed, as shown on the chart above.
3- Entry and exit points

In this step you set the entry points based on RSI signals and on price movement inside the range. In the chart below you can see several trade opportunities that appeared (marked in green).
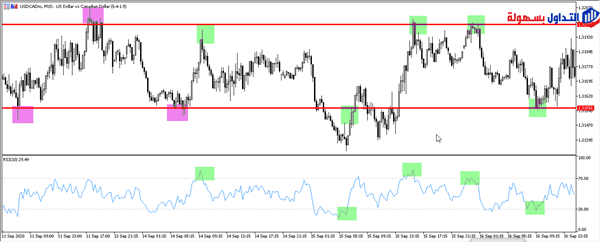
From the chart above you can conclude that the entry area forms when the RSI reaches an overbought or oversold condition.
Our first opportunities were on the sell side, where the indicator reached an overbought condition as price approached the resistance level.
Note: a trade cannot be taken the moment the RSI reaches a saturation level; price itself must also reach a support or resistance area.
4- Setting targets
Targets in this strategy can be set in two ways. The first is as soon as the RSI reaches a saturation level, but this method can produce some errors, because the indicator may reach saturation before price reaches the support or resistance area, so you miss many points. The second method is preferred: wait until price reaches a resistance or support area.
5- Setting the stop-loss
The stop-loss order can be placed slightly above or below the resistance or support line, but it is better to place the stop at the highest peak price reached in a sell, and at the lowest trough in a buy, to avoid any possible widening of the spread or a false break.
Both new and experienced euro traders can apply this simple currency strategy, which relies on repeated price movement within a range.
Stock traders can also apply it while tracking the foreign-exchange pair in real time, and inverse ETF traders can use it as well, since it mainly requires having the skills to manage the added risk.
Read also: What is the Relative Strength Index (RSI)?
Read also: The supply and demand strategy in trading.
Read also: CCI indicator — the Commodity Channel Index and its best settings.
Try this strategy on a demo account first
A strategy that looks clear in an article can behave very differently under real spreads and volatility. Testing it on a demo account shows you how it performs before you commit any capital.
Advertising disclosure: partner link. Easy Trade may receive compensation. Educational content, not financial advice. CFDs carry a high risk of losing your capital.