
Bullish Japanese Candlestick Patterns

Bullish Japanese candlestick patterns are a type of Japanese candlesticks, the price charts that show the open, close, high, and low for each set time period. Candlesticks were invented by Japanese rice traders centuries ago and spread among Western traders through a broker named Steve Nison in the 1990s.
Using bullish candlesticks, you can learn a lot about market movement during a given period. A long body on a green candle, for example, tells you that a large upward price move took place.
If the wick is longer than the long body, that points to a high level of volatility during that period — the bulls and bears may have been competing for control, with the bulls winning out in the end.
Technical traders treat certain bullish candlestick formations as indicators of possible future movement. The idea behind this is simple: these patterns reveal specific behavior that has often led to certain outcomes in the past, and the assumption is that similar behavior may repeat.
How Do You Use Bullish Candlestick Analysis?

A candlestick chart gives a trader important information about price movement at any given point in time. Traders often confirm their signals using candlestick patterns as part of their overall trading approach.
Trading price action using candlesticks alone is a very common technique. Even so, trading bullish candlesticks tends to be strongest when confirmed with additional indicators or combined with support and resistance zones.
Bullish Candlestick Patterns for Beginners
Bullish candle patterns, or bullish Japanese candlesticks, signal that the market may be about to make an upward move. They come in two main forms: reversal patterns and continuation patterns.
A reversal pattern signals that a market in a downtrend may be about to turn back up. Continuation patterns, on the other hand, occur during an uptrend and can signal that momentum has not slowed yet.
As always, confirming a bullish candlestick before trading it matters. A simple confirmation is checking whether the rally has actually started, which can take the form of a bullish green candle or the market breaking through a resistance level. Below are some of the main bullish reversal patterns:
First: The Hammer
The hammer is a single-candle pattern made up of a short body with a long lower wick and a small or non-existent upper wick. It is seen as a sign of an approaching bullish reversal, meaning that if you spot it during a downtrend, the market may be about to turn back up.
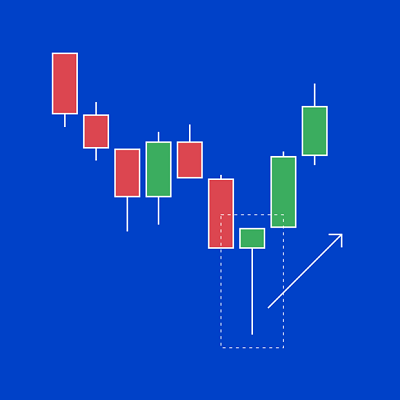
That’s because sellers pushed the price down toward new lows during the candle’s time period, but they were unable to hold it there against buyer resistance, so the candle closed near its opening price.
If the hammer is red, the market closed slightly below the opening price. If it’s green, it closed above the opening price, which means the bullish signal is stronger.
To identify a hammer candle, look at the length of the body compared with the lower wick — the wick should be two to three times longer than the body.
Second: The Inverted Hammer
The inverted hammer is a hammer turned upside down: it forms with a short body, a long upper wick, and a small or non-existent lower wick.

As the name suggests, the price action is the reverse of what happens in the hammer. Bulls initially take charge at the start of the candle’s time period, sending the market up after a downtrend, but the move doesn’t hold, and the bears make sure the price ends up close to where it started.
Here, sellers weren’t able to resume the downtrend, which is a signal that momentum may be about to shift upward soon.
Third: Bullish Engulfing
The bullish engulfing pattern forms across two candles. The first is red, appearing as part of a downtrend or after a downward move, and the red candle is followed by a green candle that fully engulfs it — meaning the market opened lower but pushed past the high of the previous candle’s time period.

Despite the weak start to the candle, where the market opens below the previous close, the second candle in the bullish engulfing pattern shows strong upward momentum. There should be a small visible upper or lower wick, since the market ends at or near the candle’s high and barely dips below its low opening level. Technical traders take this as a sign that renewed buying sentiment may turn into a new uptrend.
Fourth: The Piercing Line
Like bullish engulfing, the piercing line consists of two candles that point to a positive market reversal — the first is red and the second is green.
But in the piercing line, the red candle has a long body and isn’t engulfed by the candle that follows it — instead, a price gap appears. The market typically gaps between the red candle’s close and the green candle’s open, but then rallies past the midpoint of the previous candle’s range.
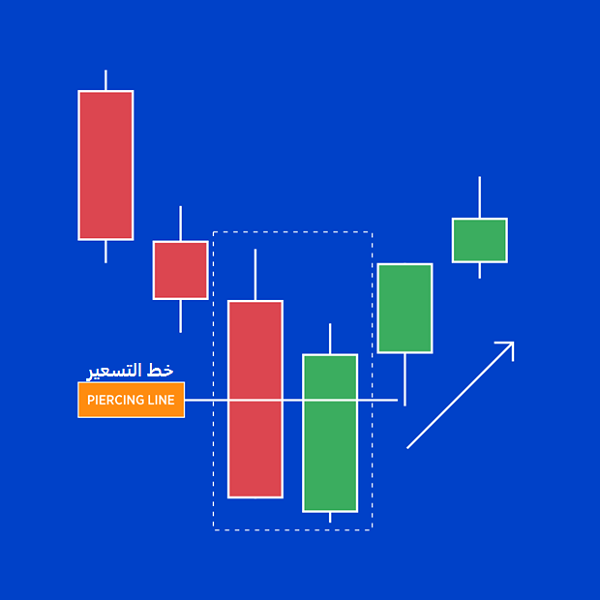
Here we’re still looking at a market reversal, but this time the bears had full control of the market through part of the second candle, before the bulls took control of the trend.
Fifth: Tweezer Bottoms
A tweezer bottom is made up of two nearly identical candles, except that the first is red and the second is green, and both must have a short body and a longer lower wick.

The two matching lower wicks show that sellers tried to push the price down on each candle, but in both cases buyers overpowered them. On the second candle, buyers pushed the price above the opening level, as bullish sentiment won out over the bears.
Tweezer bottoms are easy to spot because they look like tweezers, and they don’t appear as often as some of the other patterns covered here.
Sixth: Morning Star
In the morning star, three candles show a fairly clear shift in trend. The first is a long red candle showing the downtrend continuing. The second has a short body, since indecision is weakening the trend. The third is a long green candle, and this is where the bullish reversal takes shape.
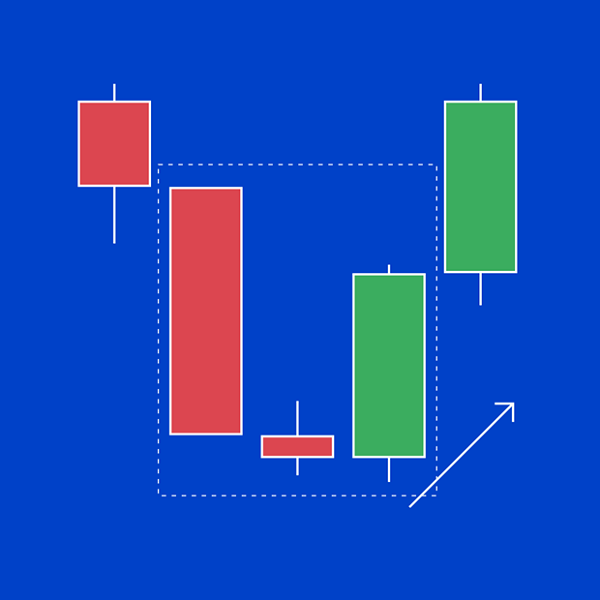
The key candle here is the middle one, which is usually a sharp peak, an indicator that the downtrend is nearing its end. If the middle candle is a doji, the signal is considered stronger.
To confirm you’ve correctly identified a morning star, check that the third candle closes past the midpoint of the first candle’s range.
Seventh: Three White Soldiers
The three white soldiers pattern appears after a sharp downtrend, and technical traders regard it as one of the stronger indicators that a reversal is taking place.
It’s made up of three green candles that follow a long red session. The first should close at around 50% of the previous candle’s range, the second should close above the red candle’s open, and the third is a long green candle that suggests the uptrend is settling in.
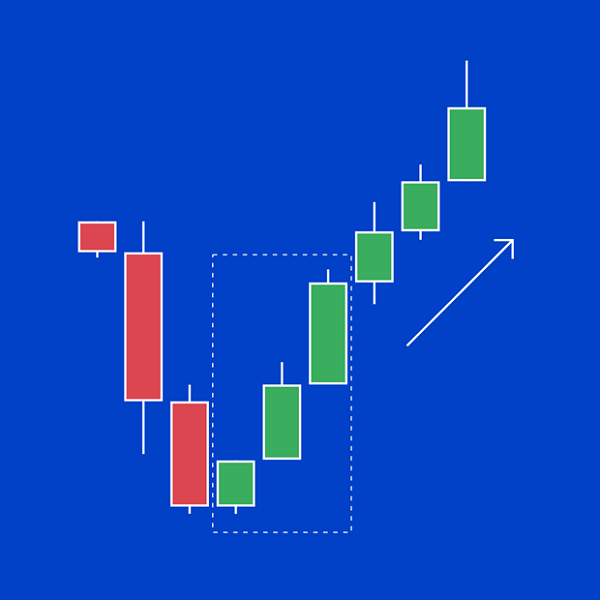
To identify this pattern correctly, each candle, or “soldier,” should have a longer body than the one before it, as upward momentum builds.
Bullish Continuation Patterns
Bullish continuation patterns are useful for checking whether an existing uptrend still has strength. Say, for example, you want to buy EUR/USD while it’s rising but you’re worried it might turn back down — a continuation signal from a bullish candlestick indicates the trend hasn’t run its course yet.
First: Bullish Marubozu
The simplest sign that a trend has real strength is a green marubozu candle. Marubozu candles are easy to spot: they have a strong body and no wick on either side, since the session opened at its lowest point and closed near its high. That’s where the pattern gets its name — marubozu is a Japanese word meaning “bald.”
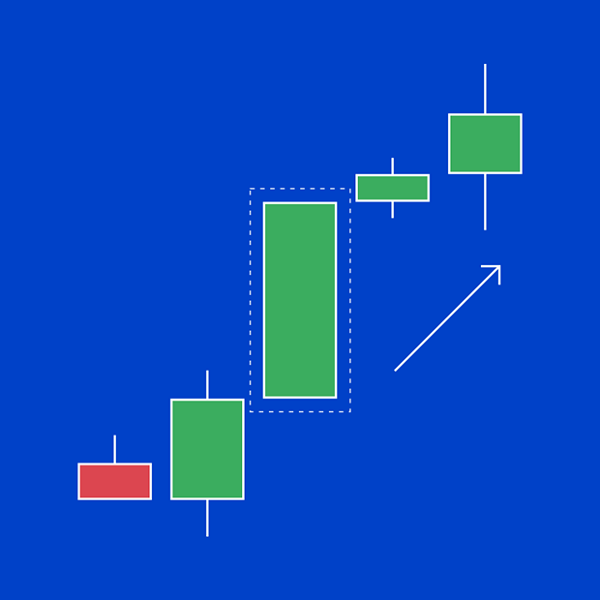
In a green marubozu, the bulls have close to full control, and the longer the body, the stronger the uptrend.
Second: Bullish Harami
The bullish harami consists of two candles — a long red one, followed by a short green one that sits entirely within the range of the red candle before it.
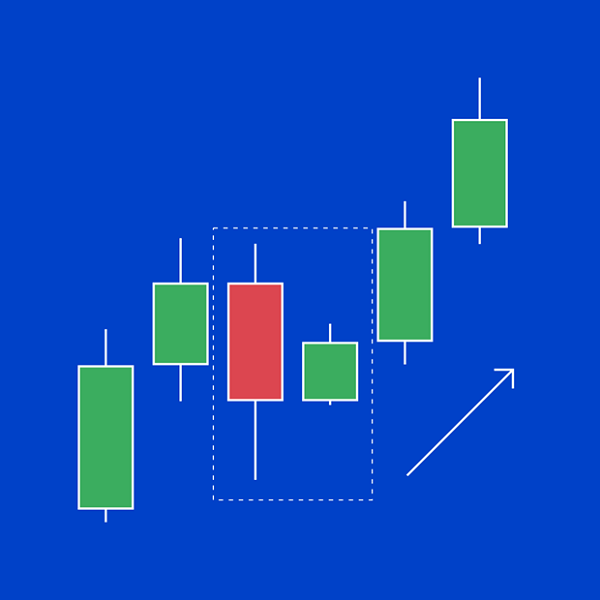
If it appears during a downtrend, it can signal a bullish reversal, but during uptrends it’s treated as a continuation pattern.
In the harami, the strong selling sentiment shown by the first candle gives way, letting buyers enter the market. These buyers aren’t able to push the price up yet, but they halt the decline as upward momentum builds, and the uptrend may continue or begin to form.
Third: Rising Three Methods
Rising three methods is a bit more complex than the patterns above — it’s made up of five candles that can look like a reversal at first glance.
A long green candle is followed by three smaller red candles, and all three red candles should fall within the open-to-close range of the first green candle. After that, the fifth and final green candle pushes the market back above the close of the first candle.
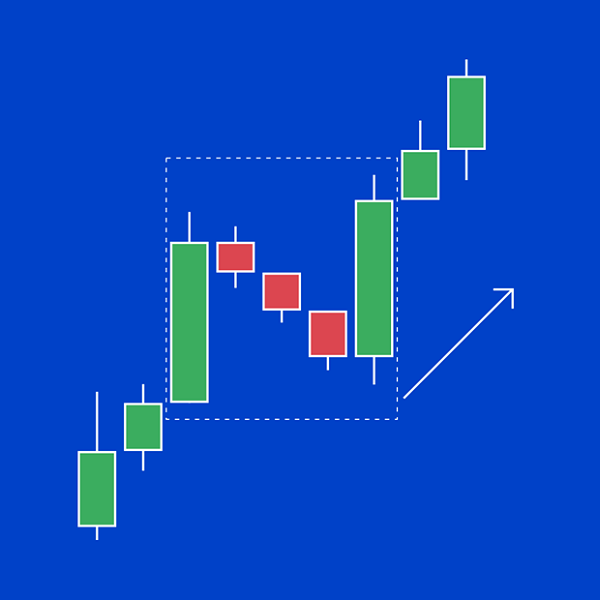
Here, even though sellers were in control for three candles in a row, their momentum was weak — it failed to erase the gains made in the first candle. When buyers return to the market, they easily overcome the sellers and the original uptrend resumes.
Ultimately, when trading any candlestick pattern, it’s always best to look for confirmation before opening your position. Patterns are not a guarantee of future behavior, so waiting for confirmation can help reduce the risk of loss if the trend fails to reverse or continue.
There are several different ways to confirm a pattern before trading it. For example, you can wait for the resulting trend or continuation to begin before trading it, or you can look at a shorter-term chart for a closer look at the current price action.
Technical traders use bullish reversal patterns to try to estimate when a downtrend might be ending and a rally might begin. These patterns tend to show up in two places: at the bottom of a downtrend, or during a period of sideways movement shortly after a downtrend.
Test this indicator without risking capital
Reading about an indicator is not the same as watching it behave on a live chart. A demo account lets you apply the settings above to real market data and see how the signals form before any money is involved.
Advertising disclosure: partner link. Easy Trade may receive compensation. Educational content, not financial advice. CFDs carry a high risk of losing your capital.
Disclaimer: This article is for educational purposes only and does not constitute investment or trading advice. Trading forex and CFDs involves leverage and carries a high level of risk to your capital, and may not be suitable for every investor. Candlestick patterns are a way of reading price charts, not a guarantee of any future outcome, and signals from them can fail. This page may include affiliate links; we may earn a commission if you open an account through them, at no extra cost to you.