
Bullish Engulfing Pattern Explained

The bullish engulfing pattern is a bullish candle that closes above the previous candle’s open, after opening below the previous candle’s close. The easiest way to recognize it: a small-bodied bearish candle is always followed by a larger bullish candle, and the pattern is complete once it’s clear that the body of the bullish candle engulfs the small body of the bearish candle before it. In this article we look at one of the secrets of Japanese candlesticks: the bullish engulfing pattern.
Read more: Learn about the most famous Japanese candlestick patterns
Key Points on the Bullish Engulfing Pattern:
- The bullish engulfing pattern is a Japanese candlestick pattern that forms when a small bearish candle is followed by a larger bullish candle that engulfs the small body of the bearish candle before it.
- Bullish engulfing patterns are more likely to signal reversals when they are preceded by four or more bearish candles.
- Investors should look not only at the two candles that make up the bullish engulfing pattern but also at the candles that came before it.
Understanding the Bullish Engulfing Pattern:

The bullish engulfing pattern is a two-candle reversal pattern in which the second, bullish candle fully engulfs the real body of the first, bearish candle, regardless of the length of the candles’ wicks.
This pattern appears in a clear downtrend and is a combination of one small bearish candle followed by a larger bullish candle. In the confirming candle that comes after the pattern, price opens below the low of the previous candle; however, buying pressure then pushes price above the high of the previous candle, confirming that strong buying positions have been taken.
More: Trading Strategy for the Engulfing Candle Pattern
What Does the Bullish Engulfing Pattern Tell You?
The bullish engulfing pattern should not be read as simply a bullish candle following and engulfing a small bearish candle to represent upward price action. For the bullish engulfing pattern to form, the asset must open lower, in the second, larger bullish candle, than the closing price of the first, bearish candle. If price does not drop first, the body of the bullish candle has no chance to engulf the small body of the bearish candle before it.
Because price opens lower than the close of the first bearish candle and then closes higher than it opened, the following bullish candle in the bullish engulfing pattern represents a day when bears are in control of the price only at the start, before bulls decisively take over by the end.
The engulfing bullish candle is also usually tall, with a small or non-existent upper wick, meaning price closed at or near its high, which suggests the session ended while price was still climbing.
The absence of an upper wick makes it more likely that the next session will produce another bullish candle closing above the close of the bullish engulfing pattern, as a first target. That said, the pattern can also be followed by a bearish candle, particularly around daily, weekly, or monthly opens with price gaps, since bullish engulfing patterns strongly point to trend reversals, which is why analysts pay close attention to them. Below is an example of the Bullish Engulfing pattern:
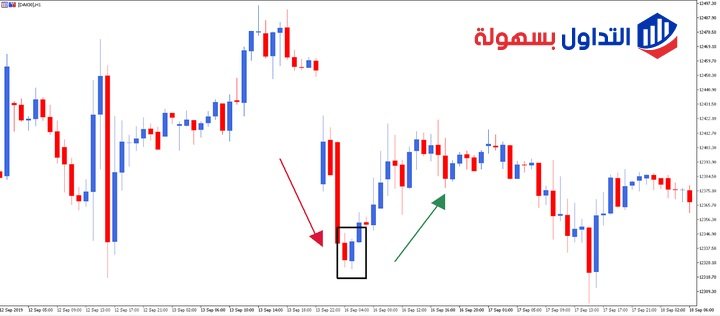

Bullish Engulfing Candle Reversals:
Investors should look not only at the two candles that form the bullish engulfing pattern but also at the candles before it. This wider context gives a clearer picture of whether the bullish engulfing pattern represents a genuine trend reversal.
Bullish engulfing patterns are more likely to signal reversals when they are preceded by four or more bearish candles. The more prior bearish candles the bullish engulfing candle swallows, the greater the chance of a trend reversal forming, which is confirmed when a second bullish candle closes above the bullish engulfing candle.
Ultimately, traders want to know whether the bullish engulfing pattern represents a shift in sentiment, meaning it may be a good time to buy. If volume rises along with price, more aggressive traders may choose to buy near the end of the bullish candle, expecting the upward move to continue on the next candle. More conservative traders may wait for the next candle and trade the potential gains once they have more certainty that the trend reversal has actually begun.
Limits of Using the Bullish Engulfing Pattern:
The bullish engulfing pattern can be a strong reversal signal, especially when combined with the prevailing trend, but it is not confirmation on its own. Bullish engulfing patterns are most useful after a strong, clear downward price move, where the pattern clearly shows the shift in momentum toward an uptrend. If price action is choppy, even when price is generally rising, the significance of the engulfing pattern is reduced, since it becomes a fairly common, frequent signal.
The engulfed, or second, candle can also be quite large, and this can leave a trader with a very wide stop-loss if they choose to trade the pattern, one that potential profits may not justify against the risk taken.
Identifying a potential profit target can also be difficult with bullish engulfing patterns, since candlestick patterns do not provide a price target on their own. Instead, traders need other methods to set profit-taking and stop-loss levels, such as indicators or trend analysis, to define a price target or the timing for exiting a trade at a profit.
The bullish engulfing pattern is one of the financial charting tools that track the movement of securities; it traces back to Japanese candlesticks and to modern price charts, which some investors find visually more appealing than standard bar charts and easier to read for price action.
The bullish engulfing pattern gets its name because the rectangular body with lines on both ends resembles a candle with wicks; each candle typically represents one day of price data, and candlesticks group into recognizable patterns that investors can use to make buy and sell decisions.
Read more:
- Best Types of Japanese Candlesticks
- How to Use Price Action on a Candlestick Chart the Right Way
- High Wave Candle Pattern
Test this indicator without risking capital
Reading about an indicator is not the same as watching it behave on a live chart. A demo account lets you apply the settings above to real market data and see how the signals form before any money is involved.
Advertising disclosure: partner link. Easy Trade may receive compensation. Educational content, not financial advice. CFDs carry a high risk of losing your capital.
Disclaimer: This article is for educational purposes only and does not constitute investment advice. The bullish engulfing pattern is an analytical tool, not a guarantee — the reversal it points to may or may not occur, and past repetition of the pattern does not ensure future results. Trading forex and CFDs involves leverage and carries a high risk of losing money quickly; you should fully understand the risks before trading. Some links on this page may be affiliate links, meaning Easy Trade Web may earn a commission at no extra cost to you if you sign up through them.