
Fibonacci Retracement Drawing Indicator

- A free MT4 add-on that plots Fibonacci retracement levels
- Draws all the standard Fibonacci levels on the chart
- Helps you place the Fibonacci retracement tool on a chart
- Works on any currency pair and timeframe
- Compatibility: MetaTrader 4
The first thing to know about the Fibonacci retracement tool is that it works best when the forex market is trending.
The idea is to buy on a pullback to a Fibonacci support level when the market is moving up, and sell on a pullback to a Fibonacci resistance level when the market is moving down.
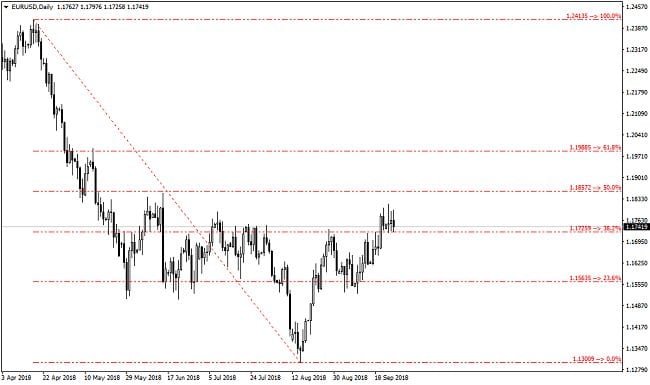
How the Fibonacci Retracement Drawing Indicator Works
On your chart, the Fibonacci retracement indicator appears as a set of lines for the different levels, and setting up this indicator is a straightforward process.
Before you add the Fibonacci retracement indicator to your chart, set a trend line connecting two extreme price points, such as the lowest and highest price of a given period. Each Fibonacci level is then plotted as a horizontal line crossing that trend line.
Fibonacci level numbers are expressed as a percentage of the retracement: 0.0, 23.6, 38.2, 50, 61.8 and 100%. Other levels can also be used. The 61.8% ratio is known as the golden ratio, the value obtained by dividing one Fibonacci number by the next number in the sequence, for example 89/144 = 0.6180 (sometimes called the golden Fibonacci ratio). If you want to check it numerically, compute the levels instead of drawing them by eye.
The 38.2 level is the number obtained by dividing one Fibonacci number by the second number before it in the sequence, for example 34/89 = 0.382. The other Fibonacci retracement levels are calculated the same way, based on ratios or rules that follow the Fibonacci sequence.
The purpose of using the Fibonacci retracement drawing indicator in trading is to measure how far price has pulled back, or corrected, compared with its previous move. Fibonacci retracement lines are used to mark possible points where price could turn and reverse the direction of the prior move — this is not guaranteed, and price does not always react at these levels.
You can set up the Fibonacci retracement indicator on the chart for different assets and financial instruments, and across different timeframes. Longer timeframes can generally give a clearer view of how price moves toward the retracement levels compared with shorter timeframes.
Fibonacci Retracement Trading Strategy
Traders use this indicator as part of a trading strategy because it can help flag possible entry and exit points, and whether to look for a buy or a sell in the market. As a trader, you can watch for price to possibly reverse direction once it reaches a given Fibonacci retracement level — this is a signal to watch for, not a guarantee.

Fibonacci trading is generally recommended in a market with a clear trend, so you should first try to identify a strong market direction, or look for an asset moving in a strong trend where price shows some pullback before it reverses. You can set the Fibonacci retracement indicator’s levels to flag possible reversal signals and open a position in the same underlying trend direction.
Executing trades with a Fibonacci trading strategy means looking for entry points at the retracement and waiting for price to move back in the direction of the original trend. Fibonacci retracement can also be used to flag possible reversal signals in price.
Fibonacci trading can be one way to plan entries and exits from trading positions, but you should recognize that not every trade reverses back toward the original trend. This means you cannot simply assume a signal will play out every time price reaches a given level.
The Fibonacci retracement drawing indicator tends to work best when it is part of a trading strategy built from several indicators, so use Fibonacci retracement alongside other tools such as candlestick patterns, oscillators, moving averages, the Relative Strength Index (RSI), or price action levels.
Frequently Asked Questions
What is the Fibonacci tool?
The Fibonacci tool is a technical analysis tool used to identify possible support and resistance levels in financial markets. It’s based on a series of numbers called the Fibonacci sequence, calculated by adding the two preceding numbers together: 1, 1, 2, 3, 5, 8, 13, 21, 34, 55, and so on. These numbers are used to build Fibonacci ratios, which can be used to identify possible support and resistance levels for price in financial markets. The Fibonacci tool can be applied to a wide range of financial assets, including stocks, commodities, currency pairs, and cryptocurrencies.
How is Fibonacci drawn?
Fibonacci levels are drawn by marking two points on the chart. The first point represents the full move in price from the low to the high, while the second point represents a decline in price from the high to the low. Charting tools on most trading and technical-analysis platforms can be used to plot Fibonacci levels easily. Fibonacci levels are usually drawn between the three well-known values of 38.2%, 50%, and 61.8%, which are commonly used as possible support and resistance levels. Other Fibonacci ratios can also be used to get further possible support and resistance levels.
What is the Fibonacci retracement drawing indicator?
There is no single dedicated indicator for drawing the Fibonacci tool — you can use the charting tools already available on your trading platform to draw Fibonacci levels. In general, technical-analysis and charting tools are provided in the menus of brokerage platforms or other trading systems. These tools can be used to identify possible chart patterns and possible support and resistance levels in financial markets.
Disclaimer: All information in this article is for educational purposes only and does not constitute investment advice or a trading recommendation. Trading forex and CFDs involves a high level of risk due to leverage and may result in the loss of some or all of your invested capital. Technical indicators such as Fibonacci retracement do not guarantee results, and price does not always react at the levels they show. This article may contain affiliate links through which we may earn a commission at no additional cost to you.