
CCI Indicator: Best Settings Explained

The CCI indicator is one of the momentum indicators widely used on the chart. The abbreviation CCI stands for Commodity Channel Index. Even though it’s called the Commodity Channel Index, it’s used across a wide range of investment instruments, including currencies, commodities, and stocks. In this article, we’ll walk through a full explanation of the CCI indicator.
What Is the CCI Indicator?
It’s one of the momentum indicators, developed in 1979 by a man named Donald R. Lambert. The CCI indicator has several uses: it can be used to identify oversold and overbought zones, to measure trend strength, and to spot divergences.
The indicator’s reading ranges between the +100 and -100 levels, which can be changed to +200 and -200. These levels point to oversold and overbought zones.
How to Add the CCI Indicator to MetaTrader?
Fortunately, you don’t need to download and install the indicator on the MetaTrader platform. All you need to do is follow the steps shown in the image below.
Afterward, the settings will appear as shown in the following image.
You’ll see the number of periods the indicator will use. The default setting is 14, meaning the indicator bases its calculations on the last 14 candles. You can change this according to your strategy.
In the Levels option, you can change the levels the indicator moves between, as shown in the following figure.
As you can see, the default levels are +100 and -100. You can change them as mentioned above.
In the Price option, you can change how the indicator’s reading is calculated, whether based on the candle close, high, or low. Note the following figure.
In the end, the indicator will appear as shown in the following figure.
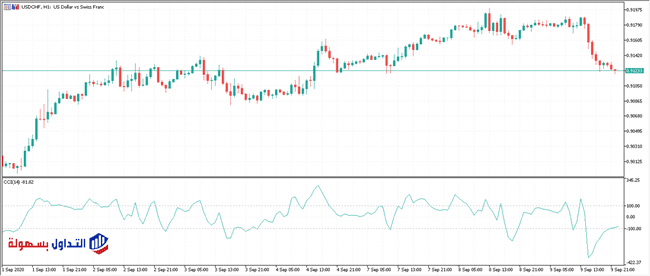
How to Use the CCI Indicator
The indicator can be used to:
- Determine trend strength.
- Show oversold and overbought zones.

Using the CCI Indicator to Determine Trend Strength
The indicator can be used to determine trend strength by tracking momentum. If the indicator shows strong momentum, that’s evidence the price will continue in its current direction. If the indicator shows weak momentum, that’s evidence of a correction or reversal in price action.
So the question here is: how can momentum be measured using the indicator? It’s very simple. All you need to do is pick two peaks or two troughs on the indicator and compare them with two peaks or two troughs on the chart, as shown in the figure.
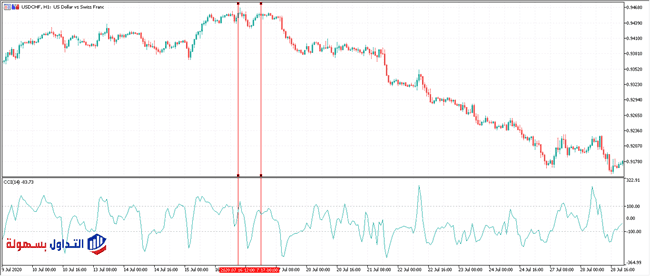
You’ll notice in the previous figure a divergence between price action and the indicator’s reading: the indicator’s reading was falling while price action moved sideways, which means buying momentum is weak and a correction or reversal is likely.
When using the CCI indicator to measure momentum, it’s preferable to use a moving average for extra confirmation.
CCI Strategy for Identifying Oversold and Overbought Zones
The best time to use the indicator to identify oversold and overbought zones is during sideways price action. Once you find a sideways range, look for the peak and trough levels on the chart. After that, once the price reaches the upper range, check the CCI indicator for a sign of overbought conditions, meaning the CCI indicator will reverse after rising above the +100 level and price action will follow. Similarly, when the price is at the bottom of the range, the CCI indicator will bounce back at the -100 level. Note the following figure.
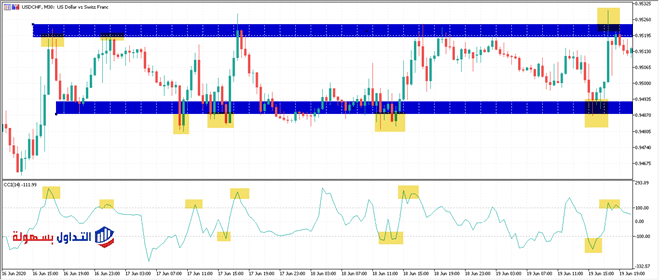
In the previous figure, you’ll notice that the price was moving sideways and would bounce near the upper or lower boundary, with that bounce preceded each time by a signal from the CCI indicator.
Conclusion
The Commodity Channel Index (CCI) is a momentum-based oscillator used to help identify when an investment instrument reaches an overbought or oversold state.
The CCI technical indicator, developed by Donald Lambert, assesses price direction and strength, letting traders decide whether to enter or exit a trade, hold off from entering a trade, or add to an existing position. This way, the CCI indicator can be used to provide trading signals in a specific manner. Here’s what matters most when using it:
- It’s one of the momentum indicators, developed in 1979 by a man named Donald R. Lambert. The CCI indicator has several uses: it can be used to identify oversold and overbought zones, and it can also be used to measure trend strength and detect divergences.
- The CCI indicator’s reading ranges between the +100 and -100 levels, which can be changed to +200 and -200. These levels point to oversold and overbought zones.
- The best time to use the CCI indicator to identify oversold and overbought zones is during sideways price action.
Test this indicator without risking capital
Reading about an indicator is not the same as watching it behave on a live chart. A demo account lets you apply the settings above to real market data and see how the signals form before any money is involved.
Advertising disclosure: partner link. Easy Trade may receive compensation. Educational content, not financial advice. CFDs carry a high risk of losing your capital.
Disclaimer
This article is for educational purposes only and does not constitute investment advice. Trading currencies, commodities, and CFDs involves significant risk, and leverage can amplify both gains and losses; most retail traders lose money trading these products. Some links on this page may be affiliate links, meaning easytradeweb.com may earn a commission at no extra cost to you if you use them. Always test any indicator or settings on a demo account before applying them to a live one.