
Multi-Timeframe Sync Indicator

A multi-timeframe sync indicator gives traders a full view of market structure by showing the main, intermediate, and lower timeframes together. Different participants trade the forex market, which means different traders can hold different views on how to trade a pair, so trends and market sentiment can vary across timeframes. Reading them in order is covered in our guide to multi-timeframe analysis. Below is a top multi-timeframe sync indicator and its features: Related reading: Daily Pivot Point Indicator.
- A highly effective, powerful, free indicator
- Combines charts from other timeframes onto a single chart
- Helps link timeframes together
- Useful for all currency pairs and timeframes
- Compatibility: MetaTrader 4
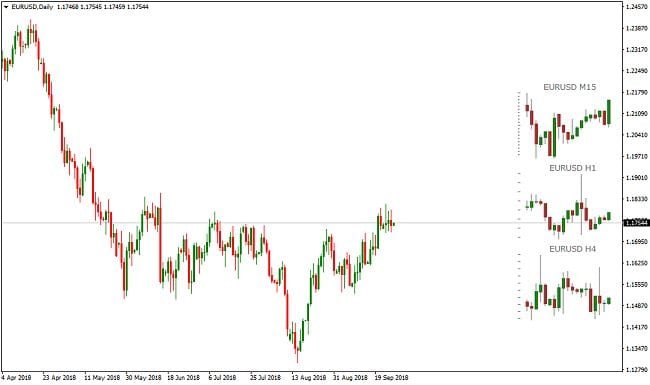
The fact that different timeframes show different market overviews and trends means smart traders need to watch the chart on each timeframe. A multi-timeframe sync indicator lets you see the different timeframes for a single currency pair on the same chart.
Multi-Timeframe Sync Indicator Basics:
The multi-timeframe sync indicator for MT4 gives a deeper view of the forex market by showing 3 different timeframes for a single currency pair on the same chart, with the three timeframes displayed in the chart’s indicator window.
The indicator also displays timeframe bars from higher to lower timeframes. The three timeframes shown are the weekly, daily, and 4-hour timeframes, in that order.
Using the multi-timeframe sync indicator helps traders decide whether to buy or sell in the forex market, for the following reasons:
- It gives different perspectives on a currency pair across the three timeframes
- It lets traders see what other market participants are thinking
- It helps traders spot trend changes early
- It helps confirm a trend change on a higher timeframe
- It helps traders identify upcoming support or resistance zones
- It lets traders see the small, medium, and big picture for a given asset.
On top of that, the multi-timeframe sync indicator can help traders enter or exit a trade at the right time in the forex market. The more timeframes involved, the more timeframes matter for market analysis, so analysis should move from higher timeframes down to lower timeframes before traders decide to buy or sell.
The weekly timeframe shown by the indicator is the main timeframe used to identify the primary trend. This timeframe shows the bigger picture of the market, and since a trend on this timeframe takes time to build, it gets top priority.
The daily timeframe shown by the indicator is the intermediate timeframe, used to identify market-structure breaks as well as entry and exit points.
Finally, the 4-hour timeframe shown by the indicator is the base timeframe used to confirm entering or exiting a position.
The multi-timeframe sync indicator can be used by every type of trader: scalpers, day traders, swing traders, and position traders. Scalpers can adjust the indicator to fit their preferred timeframes, such as M30, M5, and M1, or M30 and M15. Day traders can also set it to H4, H1, and M15, or D1, H4, and H1, and so on.
In short, the multi-timeframe sync indicator for MT4 gives traders a full view of market structure by showing the main, intermediate, and base timeframes together. Any trader can use it, and it can be adjusted in the indicator settings to fit each trader’s timeframe priorities.
Disclaimer
This article is for educational purposes only and is not investment advice. Trading forex and CFDs on margin carries a high level of risk and may not be suitable for all investors. Indicator signals like the ones described above are estimates based on price and market structure, not guarantees of future price movement, and no indicator can prevent losses. This page may contain affiliate links; we may earn a commission if you open an account through them, at no extra cost to you.