
Wyckoff Theory Explained

As a trader in the financial markets, you should be familiar with Wyckoff theory alongside a few other leading ideas about market structure and cycles. Some of the best-known frameworks that technical analysis is built on are Elliott Wave and Dow theory. After reading this article you will add another one to your technical-analysis toolkit, and it is no less important than the others. Here we look at Wyckoff theory and how it is applied in the trading markets.
Who Was Richard Wyckoff?
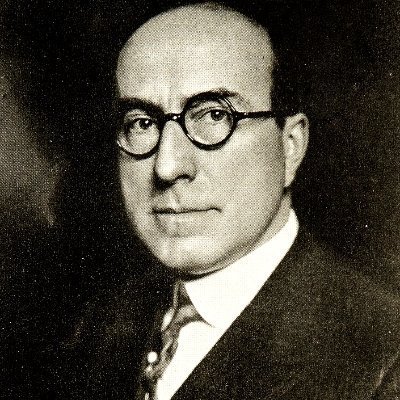
Richard Wyckoff was a trader and investor in the stock market, born in the late nineteenth century. He was drawn to the trading markets from a young age and set up his own brokerage firm in his twenties. Wyckoff built a strong reputation in trading circles, and the clearest evidence of that is the set of books he wrote on trading in the financial markets, which are still studied today.
More: Key harmonic patterns used in trading.
Wyckoff’s Core Rules
Wyckoff’s first rule tells traders and investors that the market and individual securities never behave the same way twice. Trends take shape through a wide range of similar price patterns that show endless differences in volume, detail and extent, with each pattern varying from earlier moves so that it surprises and confuses market participants.
Wyckoff’s second rule raises the often misunderstood point of market relativity. It tells traders and investors that context is everything in the financial markets. In other words, the only way to judge today’s price move is to compare it with what happened yesterday, last week, last month and last year. One consequence of this rule is that analysing a single day’s price move in isolation leads to incorrect conclusions.
Wyckoff also set out simple but powerful rules for reading the trend. He concluded that there are only three types of trend — up, down and sideways — and three timeframes: short, medium and long term. He noted that trends vary widely across different timeframes, which paved the way for later technical traders to build strong trading strategies around how those timeframes interact. Alexander Elder’s triple-screen method, described in the book Trading for a Living, is an excellent example of this kind of follow-up work.
- Rule one — prices never repeat in exactly the same way; the price move happening now will not be an identical copy of an earlier move.
- Rule two — this is tied to the first: because the current price move differs from the one before it, its significance shows up when it is compared with earlier price behaviour.
These two rules are the foundation on which Wyckoff built his theory.
The Wyckoff Price Cycle
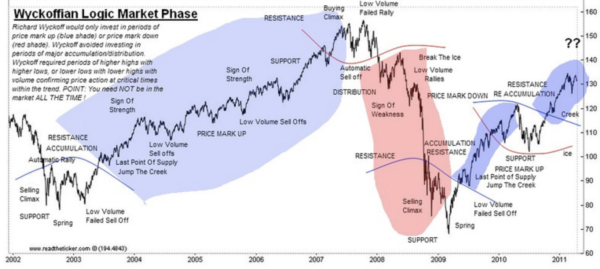
Wyckoff theory holds that price moves in a cycle of four phases:
1- Accumulation
This is the first phase of the price cycle in Wyckoff theory. Price moves within a sideways range while a tug of war plays out between sellers and buyers. The battle ends with the buyers winning, after which price enters the second phase.
2- Markup
In this phase the buyers have gained enough strength to move price higher. There is usually a break of the lower boundary of the sideways range before the move up.
3- Distribution
This phase resembles the first (accumulation): price moves within a sideways range because of the tug of war between sellers and buyers, but this time the sellers win and price enters the final phase.
4- Markdown
In this phase the sellers have gained enough strength to move price lower. There is usually a break of the upper boundary of the wide range before price falls.
Look at the figure below; it shows the phases price passes through during its cycle according to Wyckoff theory.
The Laws Behind Wyckoff Theory
Wyckoff theory rests on three core laws that are well known in the trading markets.
They are:
- Supply and demand
The law of supply and demand governs all free markets that no single party controls, which applies to the trading markets. For example, if there is heavy selling pressure it means an increase in supply, and price is likely to fall; conversely, when there is buying pressure it means an increase in demand, and price is expected to rise.
More: Supply and demand in the forex market, in brief.
- Effort versus result
This means that every effort in the market should produce a result in line with the size of that effort. For example, if price is expected to move higher, the size of the expected rise depends on the volume of contracts the buyers take on: if that volume is large, price reaches a high level, and if it is small, price moves only a few points.
- Cause versus effect
This means that every cause in the market leads to a proportional effect. Take the accumulation and distribution phases as an example: accumulation leads to a rise in prices, while distribution leads to a fall in prices.
Before going deeper into how trading is approached through Wyckoff, it is worth agreeing that he was one of the great traders who left a large mark on technical analysis, a mark on which many later theories and studies were built.
Volume Analysis
Volume matters a great deal to traders who follow Wyckoff theory, because it can provide valuable information about what is happening behind the scenes.
Volume analysis works as a confirming tool for the validity of the current move: if current volume is high, the current move is expected to continue for a while, and volume analysis can also help identify when price may shift from one phase to another.
To make the picture clearer, look at the following figure:
In the figure above you will notice that price broke the lower boundary of the sideways range in the accumulation phase, but it was a false break and price rebounded higher. At that point some traders could have been misled into taking short positions; however, looking at the volume indicator at the bottom, you will see that the selling volume that began to appear (in red) gradually declined, which does not support a short trade.
The same thing happened when price began to correct: you will notice that when price started correcting, a selling volume bar appeared (in red) but it was very low compared with the earlier one, which suggests the current move is a correction and not a reversal.
How to Trade Wyckoff Theory in Forex
Traders can aim for profit in forex using the Wyckoff price cycle. For example, if you identify the current phase as accumulation, the phase that typically follows is markup; a trader who enters a buy near the start of that phase is positioning for the anticipated upward move.
Conversely, if the phase identified is distribution, the next phase is markdown; a trader who enters a sell near the start of the move is positioning for the anticipated decline.
In other words, understanding Wyckoff theory lets you gauge the likely next direction, which you can then factor into your trades. Bear in mind that these are read-outs of market structure, not certainties — signals can fail.
This, put very simply, is the core idea that traders who follow Wyckoff theory apply.
Entry Zones
The best zone to enter buy or sell trades is when price finishes the accumulation phase and begins the markup phase — that is for buying; for selling, you should enter when price finishes the distribution phase and begins the markdown phase. The end of the move can be confirmed by a false break or by volume analysis, as explained above.
You can also take shorter trades during the accumulation and distribution phases, by selling and buying when price reaches the upper and lower boundaries inside the sideways range.
Stop-Loss Placement
As with all trading strategies, you must set a stop-loss to protect your account if your analysis fails — something that is entirely possible and normal. In this strategy we place the stop-loss below the lowest point of the accumulation phase when buying, and above the highest point of the distribution phase when selling.
Setting the Take-Profit
Since we entered a trade at the start of the markup or markdown phase, we should exit at the end of the markup phase when buying and the start of the distribution phase, and likewise exit at the end of the markdown phase.
One sign that price is moving from markup into distribution is the presence of lower or equal highs on the chart, which indicates that a sideways range is forming.
You can also wait until a false break occurs and then exit the trade, but remember that in this case you risk giving back part of the gains already made. Another approach you can rely on for exiting trades is to watch for reversal patterns and Japanese candlestick patterns.
Analysing price action through Wyckoff theory is a useful way to manage trades, so you should always stay flexible in your analysis and open to whatever the market is doing at any given time.
A Wyckoff Trade Example
Now let us take a practical example of what we studied above. Look at the following figure:
Above you see the H4 chart of the USD/CHF currency pair between May and July 2016. The image illustrates the technical-analysis approach based on Wyckoff theory.
The image begins with USD/CHF in the distribution phase. Price suddenly breaks the upper level of the distribution range, yet trading volumes at that time are declining, which casts doubt on the validity of the upside break; it can therefore be treated as a false break.
Price then reverses and breaks the lower level of the distribution range on rising volume. You could sell the USD/CHF pair and place the stop-loss above the highest point of the distribution range, as shown in the image.
You will notice in the figure that price starts falling straight after the sell, by more than 4% in less than a week, then we see the start of a sideways move, which suggests the markdown phase may have ended, so open trades would be closed here.
Price ends the markdown phase and begins accumulating, which can be seen as a sideways range inside the blue horizontal lines. During accumulation we see price fall on declining volume and break the blue channel downward; because volumes are decreasing, we expect a false break.
Price action then enters the markup phase. USD/CHF rises by more than 3.67%, after which price begins forming equal highs, indicating the markup phase may have ended. You will then notice that a false break occurred, confirming the end of the markup phase and the start of a new one that may be distribution.
Takeaway
Wyckoff’s first rule tells traders and investors that the market and individual securities never behave the same way twice, as trends unfold through a wide range of similar price patterns that show endless differences in volume, detail and extent, surprising and confusing market participants. In summary:
- Richard Wyckoff was a stock-market trader and a well-known investor who developed his theory around three laws: supply and demand, effort versus result, and cause versus effect.
- Analysing price action through Wyckoff theory is a useful way to manage trades, so you should always stay flexible in your analysis and open to whatever the market is doing at any given time.
- Among the laws that govern Wyckoff theory are the law of supply and demand, the law of cause and effect, and the law of effort versus result, together with the study of volume.
- In Wyckoff’s view the phases the market passes through are accumulation, then markup, then distribution, then markdown.
- Accumulation is the phase in which the market gathers as many buyers as possible in preparation for a rise.
- In the markup phase price has begun to use the strength gathered during accumulation.
- In the distribution phase the buyers are satisfied with the gains made, which leads to heavy selling that brings price back to earlier levels.
Frequently Asked Questions
What is Wyckoff theory?
This theory was developed by the American technical analyst Richard Wyckoff, who is considered one of the founders of technical analysis. It sets out the core elements of how a trend develops and the phases it goes through in its cycle: accumulation, then markup, then distribution, then markdown.
Does the Wyckoff method work?
Wyckoff theory is a long-established framework in technical analysis with a lengthy track record, and it is one of the foundations on which many strategies and different methods of analysis are built.
How accurate is Wyckoff?
Although the theory was developed nearly a century ago, traders still use it to read how price may develop. Like any analytical tool, it describes market structure rather than predicting it, and its signals can fail.
Who are the five giants of technical analysis?
Richard Wyckoff is considered one of the five greats of technical analysis, along with William Delbert Gann, Ralph Nelson Elliott and Merrill.
How do I know a stock is in an accumulation phase?
In the accumulation phase you can see price moving within a sideways range, with a large tug of war between sellers and buyers. This battle ends with the buyers winning, after which price moves into a new phase.
Who was Richard Wyckoff?
Richard Wyckoff was born in the late nineteenth century and was a trader and investor in the American stock market. At the age of twenty he founded his own brokerage firm. He had a distinguished record in trading circles and wrote many books on trading in the financial markets that were, and still are, studied to this day.
Related reading:
- The relationship between Elliott Wave and time analysis
- What is time analysis? Learning time analysis in the forex market
Try this strategy on a demo account first
A strategy that looks clear in an article can behave very differently under real spreads and volatility. Testing it on a demo account shows you how it performs before you commit any capital.
Advertising disclosure: partner link. Easy Trade may receive compensation. Educational content, not financial advice. CFDs carry a high risk of losing your capital.
Disclaimer: This article is for educational purposes only and is not investment advice. Trading forex and CFDs carries a high level of risk to your capital because of leverage, and you can lose more than your initial deposit. Technical methods such as Wyckoff theory describe market structure and do not guarantee outcomes; signals can fail. Do your own research and consider seeking advice from a licensed financial adviser before trading. Some links on this site may be affiliate links, and we may earn a commission at no extra cost to you.