
What Are Harmonic Patterns in Trading?

Harmonic patterns trace back to Gartley in 1932, in his book “Profits in the Stock Market.” Larry Pesavento later refined this pattern using Fibonacci ratios and set out rules for trading the Gartley pattern in his book “Fibonacci Ratios with Pattern Recognition.” See also our guide to Harmonic Trading Definition.
A few other authors developed these patterns further, but the most thorough development came from Scott Carney in his book “The Harmonic Trader,” which explains harmonic patterns in detail.
Scott Carney also created patterns such as the Gartley, Crab, Bat, Shark, and 5-0 patterns, and added real depth of knowledge around their trading rules and their risk management.
Harmonic patterns in trading take geometric price patterns to the next level by using Fibonacci numbers to pinpoint precise turning points. Unlike other, more common trading methods, harmonic trading tries to estimate future price movements. In this article, we look at some examples of how harmonic patterns are used to trade currencies in the forex market.
Fibonacci Ratios and Harmonic Patterns
Fibonacci ratios work well in any market and on any timeframe. The basic idea behind using these ratios in harmonic patterns is to identify a reversal zone — these patterns rely heavily on Fibonacci ratios.
The Gartley pattern is a harmonic chart pattern that relies on Fibonacci numbers and ratios to help traders identify the highs and lows of a price reaction. In his book “Profits in the Stock Market,” H.M. Gartley laid the foundation for harmonic chart patterns in 1935. The Gartley pattern is the most widely used harmonic chart pattern. Larry Pesavento later applied Fibonacci ratios to this pattern in his book “Fibonacci Ratios with Pattern Recognition.”
Harmonic patterns built on Fibonacci ratios provide a general yet defined shape for the pattern, which gives traders a distinct opportunity. This adds an edge for traders, offering trustworthy information about entries, targets, and stop-loss placement.
Harmonic Patterns
- AB=CD pattern
- Gartley pattern Gartley Pattern
- Shark pattern Shark Pattern
- Butterfly pattern Butterfly Pattern
- Crab pattern Crab Pattern
- Bat pattern Bat Pattern
- 123 pattern
Advantages and Disadvantages of Harmonic Patterns
Advantages
- Offers forecasts of future price movement.
- Recur often, are considered reliable, and point to relatively high-probability setups.
- Other indicators such as CCI, RSI, and MACD can be used to confirm entries.
- Work across all timeframes and all market instruments.
- Trading rules are relatively standardized through Fibonacci ratios.
Disadvantages
- Somewhat complex.
- Can be difficult to pinpoint reversal zones in most patterns.
- Complexity increases when conflicting patterns form on other timeframes.
Identifying Harmonic Patterns
It can be difficult to spot harmonic patterns with the naked eye, but once a trader understands the pattern’s structure, it can be identified relatively easily using Fibonacci ratios.
The basic harmonic patterns are 5-point patterns (X, A, B, C, D), such as the Gartley, Butterfly, Crab, Bat, Shark, and Cypher patterns.
These patterns form in “M” or “W” shaped structures, and all XABCD harmonic patterns (Gartley, Butterfly, Crab, Bat, Shark, Cypher) share similar principles and structures.
There are indicators that identify harmonic trading patterns on a chart, and several of them exist on our website, but in practice we see a lot of errors from these indicators, so they can’t be fully relied on — it’s better to identify the patterns yourself, to avoid falling into any possible error as much as you can.
The Most Popular Harmonic Patterns
There is a wide variety of harmonic patterns, though four appear more common than the rest: the Gartley, Butterfly, Bat, and Crab patterns. Whether the Wolfe Wave count belongs in this family is disputed, because its target is built from a trend line rather than from a Fibonacci ratio. A further count, the three drives count, applies the same Fibonacci extensions across three consecutive pushes rather than to a single X-to-D structure.
Gartley
The Gartley pattern was originally published by H.M. Gartley in his book “Profits in the Stock Market,” and Scott Carney later added Fibonacci levels in his book “The Harmonic Trader.” The charts shown further on are taken from that book, and over the years, other traders have arrived at some other common ratios.
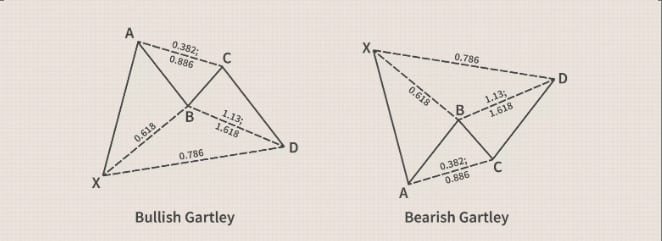
The bullish version of the pattern often signals the trend early — it’s a sign that the corrective waves have ended and an upward move should follow point D. All these patterns can appear within the context of a broader trend.
To read a harmonic pattern chart, take the bullish example above: price moves up to A, then corrects, with B as a retracement of the A wave. Price then moves up through BC, a correction of AB, and the next move down runs through CD, an extension of AB. Point D is a correction of XA.
The zone at D is known as the potential reversal zone — this is where a trader could enter buy trades, though it’s better to wait for some confirmation that price is starting to rise. The stop-loss isn’t placed far from the entry point. For the bearish version of the pattern, look to sell short near D, with the stop-loss not much higher.
Butterfly

The Butterfly pattern differs from the Gartley pattern in that its D point extends beyond point X, as shown below.
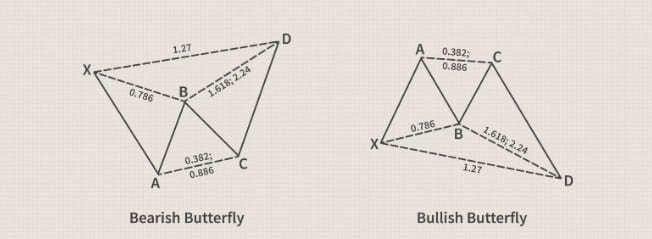
Here, take the bearish example: price drops down to A. The upward AB wave is a correction of XA. BC is a correction of AB. CD is an extension of AB. D, at an extension of the XA wave, is a zone to consider for a short trade opportunity — though you should wait for some confirmation that price is starting to drop, then place the stop-loss not far from the entry point.
Bat
The Bat pattern looks similar to the Gartley pattern, but with different measurements, as shown in the example below.
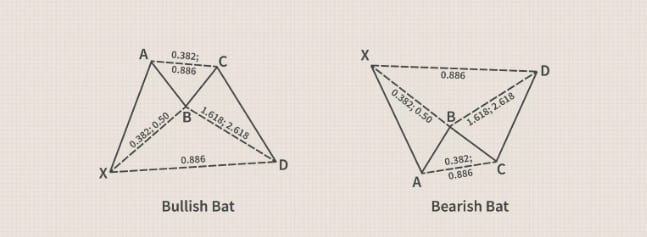
Take the bullish example above: there’s a rise through XA, then B retraces within XA. BC bounces off AB. CD is an extension of AB. D sits at a correction level of XA. D is the zone to watch for a long entry — even though you wait until price starts rising before trading, the stop-loss can be placed not far from the entry point. For the bearish version, wait for a sell opportunity near D, with the stop-loss not far from the entry point.
Crab
Carney considers the Crab one of the most precise harmonic patterns, producing reversals very close to what the Fibonacci numbers indicate. This pattern is similar to the Butterfly but differs in scale.
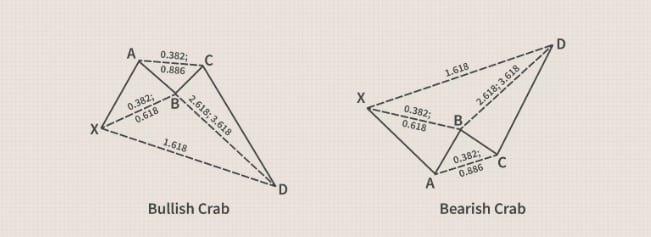
In the bullish example above, point B is a retracement of XA. BC corrects to AB. CD extends to AB. Point D is an extension of XA. Buy trades are taken near D, with the stop-loss not much lower. For the bearish version, enter a sell trade near D, with the stop-loss not far above.
How to Use Harmonic Patterns in Trading
Test this indicator without risking capital
Reading about an indicator is not the same as watching it behave on a live chart. A demo account lets you apply the settings above to real market data and see how the signals form before any money is involved.
Advertising disclosure: partner link. Easy Trade may receive compensation. Educational content, not financial advice. CFDs carry a high risk of losing your capital.
In the end, harmonic patterns — or harmonic price patterns — are patterns that take geometric price patterns to a different level by using Fibonacci numbers to identify precise turning points and enter trades ahead of a reversal, unlike other, more common trading methods. Harmonic trading also tries to estimate future price movements, and here are the main points that set it apart:
- Each pattern offers a potential reversal zone (PRZ), not necessarily one exact price, because two different projections form from point D.
- If all the projected levels sit close to each other, a trader can enter a position in that zone. If the projection zone is spread out — for example on longer-term charts where levels might be 50 pips or more apart — look for some other confirmation that price is moving in the expected direction.
- The stop-loss can also be placed outside the range farthest from the starting point. This means the stop-loss is less likely to be hit unless the pattern itself is invalidated by price moving against it.
- Overall, trading harmonic patterns is a precise, mathematical method, but it takes patience, practice, and a lot of study to master the patterns, and the basic measurements are only the starting point. Moves that don’t match the correct pattern measurements invalidate the pattern and can lead traders into losses.
- The Gartley, Butterfly, Bat, and Crab patterns are considered the best-known patterns traders watch, where entries are made in the potential reversal zone once price confirms a reversal, and stop-losses are placed below a long entry point or above a short entry point, or alternatively outside the pattern’s farthest range.
- Although they differ in their length ratios and the positions of the X, A, B, C, and D points, once you understand one pattern, the others become relatively easy to understand.
- An automatic Gartley pattern indicator on the chart may help traders spot these other patterns, instead of relying on the naked eye to find or force patterns.
- Harmonic patterns are a technical approach some traders use to look for trade setups. You may find it difficult at first to identify the correct pattern, but with time and practice it gets easier. Check the pattern’s measurements carefully, and avoid trading a pattern that doesn’t match its required ratios, since that raises the risk of a loss.
- The most popular and most-used patterns among traders are the Gartley, Butterfly, and Bat patterns.
Frequently Asked Questions
Are harmonic patterns enough for safe trading?
No, they’re not enough. Although harmonic patterns are a precise analysis tool, they alone aren’t sufficient for deciding when to open or close positions, and the possibility of error remains when using them without relying on more than one analysis tool.
What is the Fibonacci number theory?
It’s a sequence in which each term is the sum of the two preceding terms, such as 1, 1, 2, 3, 5, 8, 13, 21. This sequence is linked to harmonic patterns to identify key support and resistance points, and to estimate potential future price movement.
What is the ABCD pattern?
The ABCD pattern is a chart pattern used to identify potential long trade setups. It’s generally used intraday, though it can be applied across different timeframes. The pattern features an initial peak (A), where the price reaches its highest point of the day.
What is a harmonic pattern?
Harmonic patterns are chart patterns that form part of a trading strategy — they can help traders identify price direction by estimating potential future market movements. They form geometric price patterns using Fibonacci numbers to identify potential price changes or trend reversals.
How many harmonic patterns are there?
The basic harmonic patterns are 5 patterns (Gartley, Butterfly, Crab, Bat, Shark, and Cypher). These patterns contain 3-point structures (ABC) or 4-point structures (ABCD). All the price swings between these points are interrelated and follow harmonic ratios based on Fibonacci numbers.
Disclaimer: This article is for educational purposes only and does not constitute investment advice. Harmonic patterns are a technical analysis tool, not a guarantee of any trading outcome, and signals based on them can fail. Trading forex and CFDs involves substantial risk, including leverage risk, and most retail investor accounts lose money when trading these products. This page may contain affiliate links; Easy Trade Web may earn a commission if you open an account through them, at no extra cost to you.