
What Is Inverted Hammer?

The inverted hammer pattern — whether the hammer candle is red or green — mainly forms at the bottom of a downtrend and can act as a warning of a possible bullish reversal. The candle that follows it is often what gives traders an idea of whether prices will rise or continue falling.
What Is the Inverted Hammer Pattern?
The inverted hammer has a small real body, a long upper wick, and a small or nonexistent lower wick. It appears at the bottom of a downtrend and points to a possible bullish reversal. The extended upper wick shows that buyers in the market are trying to push the price higher, and whether this move holds or gets rejected is confirmed by the price action of the candle that follows.
The inverted hammer should not be confused with the shooting star — the two candles look similar but mean very different things. The bearish shooting star has a lower shadow and an upper wick of roughly equal length, is a bearish signal, and appears at the top of an uptrend, while the inverted hammer is a bullish signal at the bottom of a downtrend with a long upper wick and a small or nonexistent lower wick. It should also not be confused with an inverted hanging man candle.
Related: What Is the Hanging Man Pattern?
How to Identify the Inverted Hammer Pattern
It is a candle with a small real body, a long upper wick, and little to no lower wick.
The inverted hammer pattern appears at the bottom of a downtrend.
The strength of the signal increases when the candle appears near a major support level for the asset or pair.
What Does the Inverted Hammer Pattern Signal?
A reversal of the trend to the upside — a bullish reversal after a decline.
Weakening sellers, with prices sometimes bouncing higher from a key level.
Advantages and Limitations of the Inverted Hammer Pattern
As with all Japanese candlestick patterns, there are pros and cons to using the inverted hammer setup in your own trading strategy.
Advantages
- It can give precise entry points without a big drawdown: if the inverted hammer candle kicks off the new uptrend right away, traders can enter at the start of the move and capture the full upward run.
- The inverted hammer is easy to identify — the candlestick is straightforward to spot on a chart.
Disadvantages
- Over-reliance on a single candle: the inverted hammer is just one candle representing price action, and depending entirely on one candle to call a shift in market momentum, without weighing additional supporting evidence, can produce disappointing results.
- Short-lived bounces: the inverted hammer can signal a temporary uptick in price that fails to develop into a longer-term reversal of the downtrend. This can happen if buyers can’t sustain buying pressure against a dominant downtrend.
Related: Learn About the Dark Cloud Cover Pattern
Using the Inverted Hammer Pattern in Trading
Using this pattern takes a lot more than just spotting the candle. Price action and where the inverted hammer candle sits within the current trend are decisive factors in confirming it as a strong pattern.
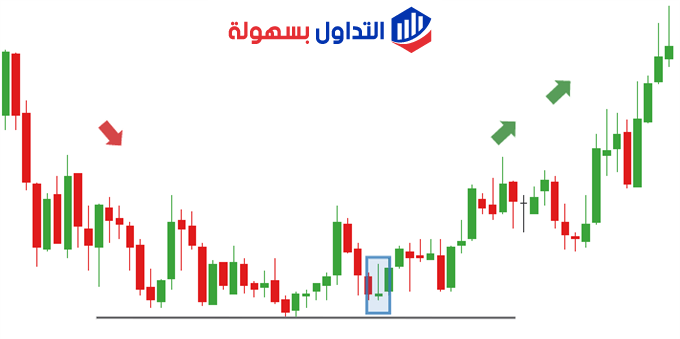
Trading with the inverted hammer pattern should happen near a major support line. The chart below shows a downtrend consolidating at support, where an inverted hammer candle appearing near that support base provides the bullish reversal signal.
Traders can place stop-loss orders below the support line to limit downside risk in case the market moves in the opposite direction.

Targets can also be set at prior resistance levels, which produces a favorable risk-to-reward ratio versus the expected profit. That’s because the inverted hammer candle often points to a reversal in the trend, and trends can run for a long time, so traders often set multiple target levels or simply use a trailing stop.
Related: What Is the 123 Pattern? An Example of the Bullish and Bearish Setup
Technical Analysis of the Inverted Hammer Pattern With Fibonacci Retracement

The inverted hammer can also be used to identify market bounces. In the chart below, the inverted hammer is highlighted in blue, renewing bullish momentum signals. The 38.2% Fibonacci retracement level provides a possible support level before the price regains its upward momentum.
Here, experienced traders look for additional confirming signals on the chart to raise the odds of a trade succeeding — signals that will either support or invalidate the trade idea before it’s placed.
In this example, the inverted hammer appears at the 38.2% level, a stronger case for a bullish reversal, as the price appears to resist further downside at that level.
To sum up, the inverted hammer pattern mainly forms at the bottom of downtrends and can act as a warning of a near-term bullish reversal after a decline. What happens in the candle that follows the inverted hammer is what gives traders confirmation of whether prices will rise or keep falling.
Related: The AB=CD Pattern, One of the Best Harmonic Patterns
Test this indicator without risking capital
Reading about an indicator is not the same as watching it behave on a live chart. A demo account lets you apply the settings above to real market data and see how the signals form before any money is involved.
Advertising disclosure: partner link. Easy Trade may receive compensation. Educational content, not financial advice. CFDs carry a high risk of losing your capital.
Frequently Asked Questions
What does the hammer candle indicate?
It indicates that the security or asset opens, trades below the open, but by the end of the period climbs back to close near the opening price — signaling an attempt to form a bottom.
What is the hanging man candle?
It’s a single-candle pattern that belongs to the bearish Japanese candlestick group. It has a small body and a lower shadow about twice the length of the body, with little or no upper shadow, and it points to a possible reversal in the stock’s move.
What are the types of candlesticks?
Japanese candlestick patterns vary widely and split into bullish and bearish reversal patterns and continuation patterns, with different shapes under each category. Some sources put the total number of candlestick types at over 100, though around 12 types are the most commonly used.
What is a reversal candle?
It’s a well-known category of Japanese candlestick pattern that anticipates a reversal in the direction of the stock — either a bullish reversal or a bearish one. The hammer candle and the hanging man candle are among its patterns.
How do you read Japanese candlesticks?
A rectangle is drawn along a single line, called the price range, between the open and close positions. A white (or green) rectangle means the close is higher than the open, while a red rectangle means the open is higher than the close.
Related:A Guide to the Best 9 Candlestick Patterns for Trading Mastery
Disclaimer: This article is for educational purposes only and does not constitute investment or trading advice. Candlestick patterns such as the inverted hammer are technical signals, not guarantees of future price movement, and trading CFDs carries a high level of risk that may not be suitable for every investor. Some links on this site are affiliate links, meaning we may earn a commission if you open an account through them, at no extra cost to you.