
Dow Theory Explained

Dow Theory is one of the oldest principles in technical analysis, and it’s the foundation almost every technical analysis theory and method has been built on for more than a hundred years. Elliott Wave Theory, one of the pioneers of technical analysis, is built largely on Dow Theory, and so is Wyckoff theory. In this article we’ll give a full explanation of Dow Theory and how it’s applied in technical analysis.
What Is Dow Theory?
Whatever your experience trading the financial markets, you’ve almost certainly heard of the Dow Jones Industrial Average (DJI), the industrial average index on the New York Stock Exchange. What many people don’t know is that the index takes its name from one of the companies owned by Charles Dow.
Dow was fascinated by how the market moved. He worked day and night to find the logic behind how markets behave, and he was one of the strongest opponents of the idea that markets move randomly. The same dispute runs through whether prices already reflect the news by the time anyone can act on it. Dow tried to demonstrate the power traders have over the markets, and that’s where it started: he built the foundation of his theory on the law of supply and demand — price rises when there’s strong demand and buying pressure from traders, and falls when the supply of a commodity or currency increases, i.e. when there’s selling pressure. While studying market movement, Dow noticed that price moves up and down in waves that can be tracked on a chart.
Charles Dow didn’t stop at explaining this theory — he wrote many reports and articles that served as a gauge of overall market activity. But the mistake Dow made was that he never organized these ideas into a coherent, structured form. Some traders, such as Sam Nelson, later reworked these ideas and presented them more clearly.
Dow believed that the stock market as a whole was a reliable gauge of general business conditions in the economy, and that by analyzing the market as a whole, a trader could accurately measure these conditions and identify the market’s main trends and the likely direction of stocks, currencies, and other assets.
Dow Theory has continued to develop over its more than 100-year history, including contributions from William Hamilton in the 1920s, Robert Rhea in the 1930s, and E. George Schaefer and Richard Russell in the 1960s. Dow’s approach still forms the core of modern technical analysis, and the basic principles of Dow Theory are:
- The market reacts strongly to news that is connected, in one way or another, to the price of a security.
Beyond the algorithms that govern how the market moves, news is the market’s biggest driver and can’t be ignored under any circumstances.
- The market moves in cycles, either up or down. Dow identified three market cycles:
- Long-term (the primary trend)
- Medium-term (the secondary trend)
- Short-term (daily fluctuations)
- Volume indicates the strength of the price trend (this doesn’t apply to the forex market)
- A trend continues until it is broken
On this point, Dow tried to show how to distinguish real trends from false ones.
The Three Price Movements of Dow Theory
Dow Theory holds that the market makes three price movements:
- The primary movement, or primary trend — the one Dow Theory traders focus on most. This trend can last from a few months to several years.
- The secondary movement, which lasts from a few weeks to a few months.
- Daily fluctuations, which can last from a few hours to a few days.
- Also read: types of forex trading strategies
You may have noticed that Dow Theory deals with the market’s core cycles. These cycles are expressed through a series of higher highs in an uptrend or a series of lower lows in a downtrend, which is why this theory is also known as the theory of peaks and troughs.
Looking at the chart above, we can define:
- The primary trend as a series of higher highs in an uptrend or lower lows in a downtrend
- Secondary movements as the corrections that occur between the rising peaks and falling troughs
- While daily trades fall within a small part of these movements
Dow Theory’s Outlook for EUR/USD
Look at the following chart for the EURUSD pair on the monthly timeframe.
Dow Theory focuses primarily on long-term trading, but if the market stays range-bound for an extended period, traders should look at a lower timeframe.
Let’s apply Dow Theory to this example.
In the chart above, the market’s primary trend can be represented by the blue line, which shows that the overall trend is bearish. This is because the market has formed a series of lower lows.
The upward corrections represent the secondary movements.
In the chart above, the primary trend only changes once the last peak in the downtrend is broken. As long as that peak isn’t broken, the movement is still just a secondary one.
Phases of the Primary Trend
According to Dow Theory, the primary trend goes through three phases:
1. The Accumulation Phase
Before the primary trend can start rising, it needs a large amount of energy to break the highest peak. It draws this energy by attracting the largest possible number of buyers, which can be called the accumulation phase. During this phase the market is often range-bound or forms a triangle, as is the case in the example we’re looking at here.
The EURUSD chart shows a triangle that formed at the end of the downtrend, signaling a shift to an uptrend — which is exactly what happened. Price formed a series of up and down waves inside this triangle, and each time it moved up, the market gained more buyers.

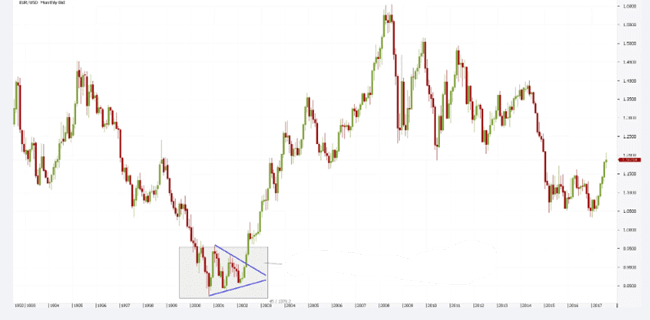
After the highest peak in the triangle is broken, we can say the trend has already shifted from bearish to bullish. Any downward corrective moves are considered secondary movements as long as they don’t break the lowest low.
Perhaps the main reason Dow Theory is accepted by so many traders is that it tells you a lot of detail.
2. The Participation Phase
In this phase, price is supported by good economic news or long-awaited political news. For example, when a country raises interest rates, you’ll notice large moves in that country’s currency, and these moves usually last for extended periods.
This is the best time to consider long-term trades. In Elliott Wave Theory, this phase is expressed as the impulsive third wave.
You can see this movement clearly in the chart above. You’ll notice fewer secondary movements during this phase because the trend is strong and supported by a large number of buyers.
3. The Distribution Phase
Once the trend has passed its peak strength, price begins forming a lot of secondary movements, which signal that a number of buyers are exiting at these prices. This can be called the distribution phase, where buyers close their open positions and settle for the profit they’ve made. Price then looks for sellers and goes through an accumulation process similar to the one described at the start of the uptrend — except this time it accumulates sellers, and the downtrend begins once the last low of the uptrend is broken.
Now that you understand how to read the market with Dow Theory, we won’t go through the next EURUSD cycle in detail, since you’re already familiar with it and know that in a downtrend the phases are:
- Distribution
- Participation
- Despair
Is Dow Theory a Technical or a Fundamental Approach?
One of Dow’s core beliefs was that everything is known — that all information is already reflected in market movement. In practice, though, when you apply this to a chart, you’ll find that technical analysis on its own can’t show the market’s big picture, while fundamental analysis tools can’t show the small details — technical analysis alone can do that. Because of this, it’s important to combine both types of analysis.
This applies strongly to Dow Theory: it’s fundamentally based on technical analysis, and fundamental analysis comes into play once the participation phase of the primary trend begins.
Confirmation in Dow Theory
When applying Dow Theory to a chart, we need other supporting factors to confirm that the action we’re about to take is correct. So what are these factors?
Many traders rely on divergence to identify expected reversals. For this, we need one of the oscillators that measures divergence — you can use indicators such as the Relative Strength Index (RSI), the Stochastic oscillator, MACD, or other oscillators.
Volume in Dow Theory
The core idea behind volume in Dow Theory is that volume should increase along with the primary trend. If the primary trend is bullish, volume should keep increasing until price starts to correct.
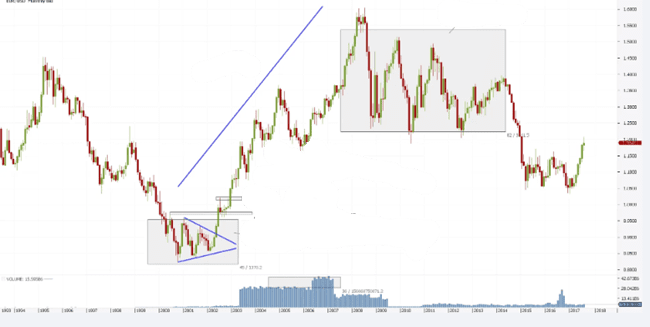
The chart above shows the trading volume for EUR/USD from an earlier period. Notice that volume was rising noticeably, then began shrinking as the number of secondary movements increased.
But remember that trading volume in the forex market can’t truly be measured — what you see is your broker’s volume, not the market’s overall trading volume. Because of this, volume can be set aside in forex trading and replaced with momentum instead.
Drawbacks of Analyzing With Dow Theory
Many argue that Dow Theory isn’t really a trading theory — that may or may not be true. But Dow Theory, as it’s also called, does let you identify strong trends you can trade for a period of time.
In the end, remember that Dow Theory is what introduced you to other trading theories such as Elliott Wave. The huge progress in technical analysis we see today exists thanks to Dow Theory.
Conclusion
- Dow Theory was the first theory to address market psychology.
- The technical analysis concept closest to Dow Theory is Elliott Wave Theory.
- Charles Dow didn’t stop at explaining this theory alone — he wrote many reports and articles that served as a gauge of overall market activity. But the mistake Dow made was that he never organized these ideas into a coherent, structured form. Some traders, such as Sam Nelson, later reworked these ideas and presented them more clearly.
- The market moves in cycles, either up or down. Dow identified three market cycles:
- Long-term (the primary trend)
- Medium-term (the secondary trend)
- Short-term (daily fluctuations)
- The primary trend goes through three phases in an uptrend:
- Accumulation
- Participation
- Distribution
- And three phases in a downtrend:
- Distribution
- Participation
- Despair
- The core idea behind volume in Dow Theory is that volume should increase along with the primary trend. If the primary trend is bullish, volume should keep increasing until price starts to correct.
- Remember that trading volume in the forex market can’t truly be measured — what you see is your broker’s volume, not the market’s overall trading volume. Because of this, volume can be set aside in forex trading and replaced with momentum instead.
- Many argue that Dow Theory isn’t really a trading theory — that may or may not be true. But Dow Theory, as it’s also called, does let you identify strong trends you can trade for a period of time.
Test this indicator without risking capital
Reading about an indicator is not the same as watching it behave on a live chart. A demo account lets you apply the settings above to real market data and see how the signals form before any money is involved.
Advertising disclosure: partner link. Easy Trade may receive compensation. Educational content, not financial advice. CFDs carry a high risk of losing your capital.
Disclaimer: This article is for educational purposes only and does not constitute investment advice. Trading forex, commodities, and CFDs involves substantial risk, including the potential loss of your entire capital, and leverage can amplify both gains and losses. Some links on this page may be affiliate links, meaning EasyTradeWeb may earn a commission if you sign up through them at no extra cost to you.