
Top 9 Japanese Candlestick Patterns

Japanese candlesticks originated in Japan more than 100 years before the West developed bar and line charts. In the 18th century, a Japanese man named Homma discovered that although there was a link between rice prices, supply, and demand, the markets were heavily affected by traders’ emotions.
Candlesticks display those emotions by visually representing the size of price moves in different colors. Traders also use candlesticks to make trading decisions based on patterns that occur regularly and help forecast the short-term price direction. To learn more about the different candle types and how to profit from them in trading, here is an overview of the most important ones in this article.
Traders use candlestick charts to identify potential price movement based on past patterns.
Candles are useful in trading because they show four price points (open, close, high, low) over the time period a trader sets.
Many algorithms rely on the same price information shown on candlestick charts.
Trading is often driven by emotion, and that emotion can be read on candlestick charts.
Components of a Japanese Candle
The inventor of Japanese candlesticks defined the components of a Japanese candle. Just like a bar chart, a daily candle shows the market’s open, high, low, and close for that day, and the candle has a wide part called the real body.
This real body represents the price range between that day’s open and close. When the real body is filled in black, it means the close was lower than the open. If the real body is empty, it means the close was higher than the open.
Read also: Trading candles — pros and cons
Traders can change these colors on their trading platform. For example, a bearish candle is often shaded red instead of black, and a bullish candle is often shaded green instead of white.
Basic Japanese Candlestick Patterns
Candles form from price moving up and down. These price moves sometimes appear random, but they occasionally form patterns that traders use for analysis or trading, and there are many candlestick patterns.
Candlestick patterns are split into bullish and bearish. Bullish patterns point to a higher probability the price will rise, while bearish patterns point to a higher probability the price will fall. No pattern works all the time, because candlestick patterns represent tendencies in price movement, not guarantees.
The Bearish Engulfing Pattern in Japanese Candlesticks
A bearish engulfing pattern develops in an uptrend when sellers outnumber buyers. This shows up as a long red real body engulfing a small green real body. This pattern signals that sellers have taken back control and the price may keep falling.
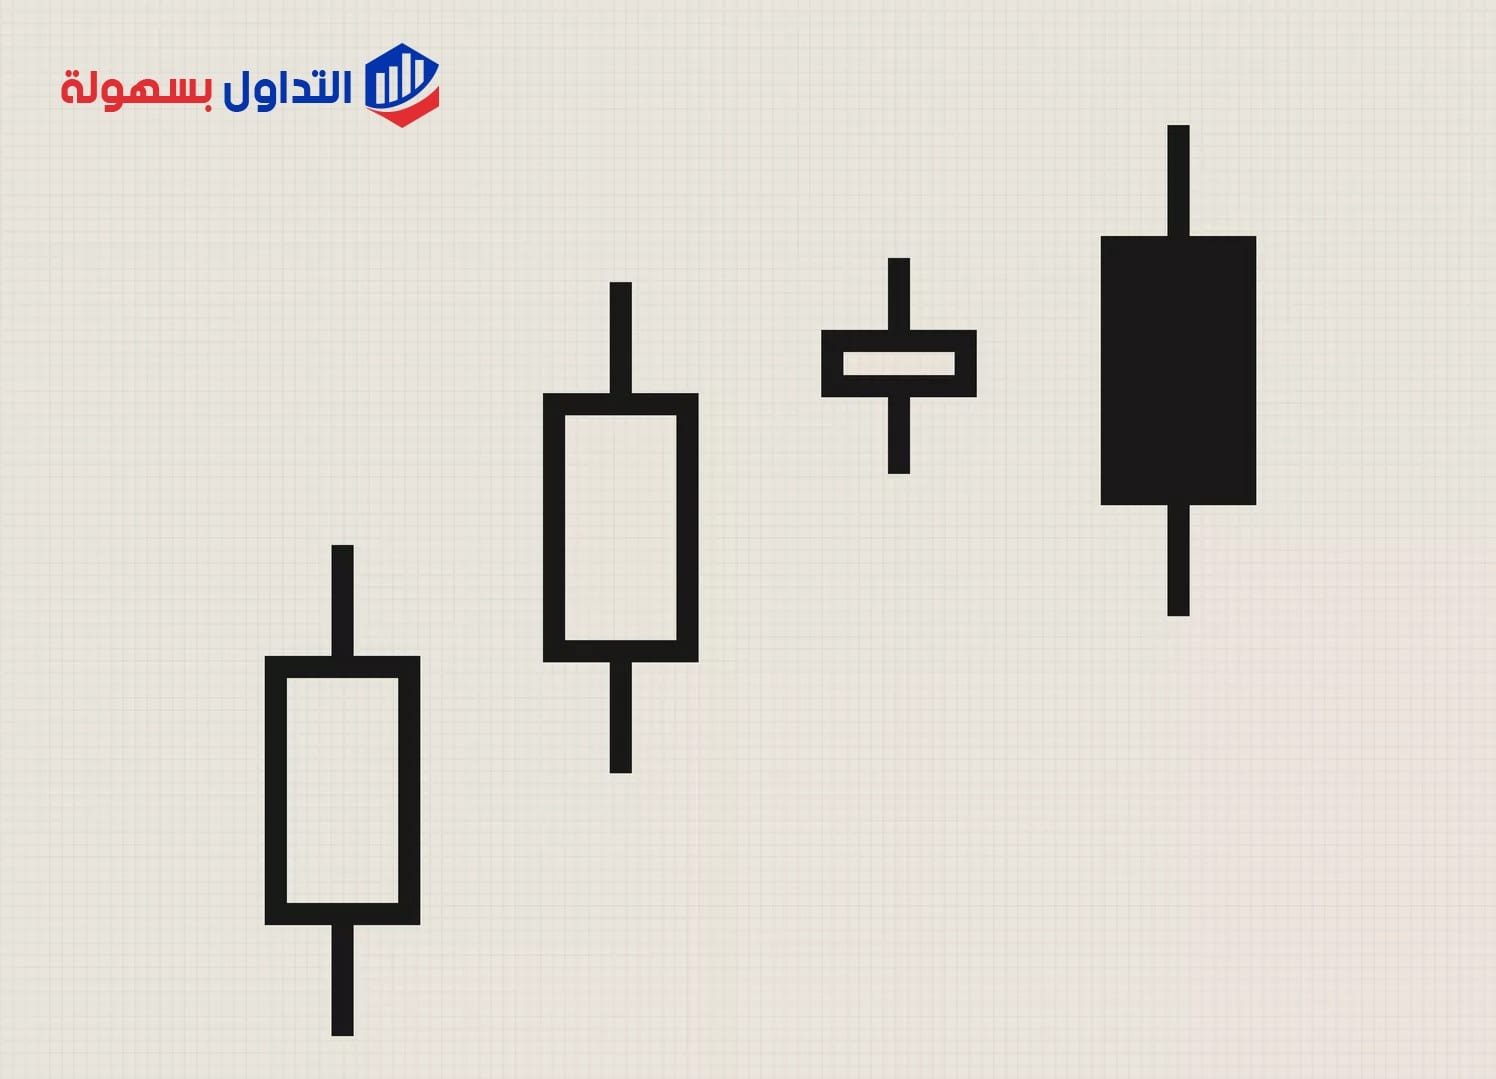
The Bullish Engulfing Pattern in Japanese Candlesticks
A bullish engulfing pattern in the market happens when buyers outnumber sellers. This shows up on the chart as a long green real body engulfing a small red real body. With some control from the bulls, the price can move higher.
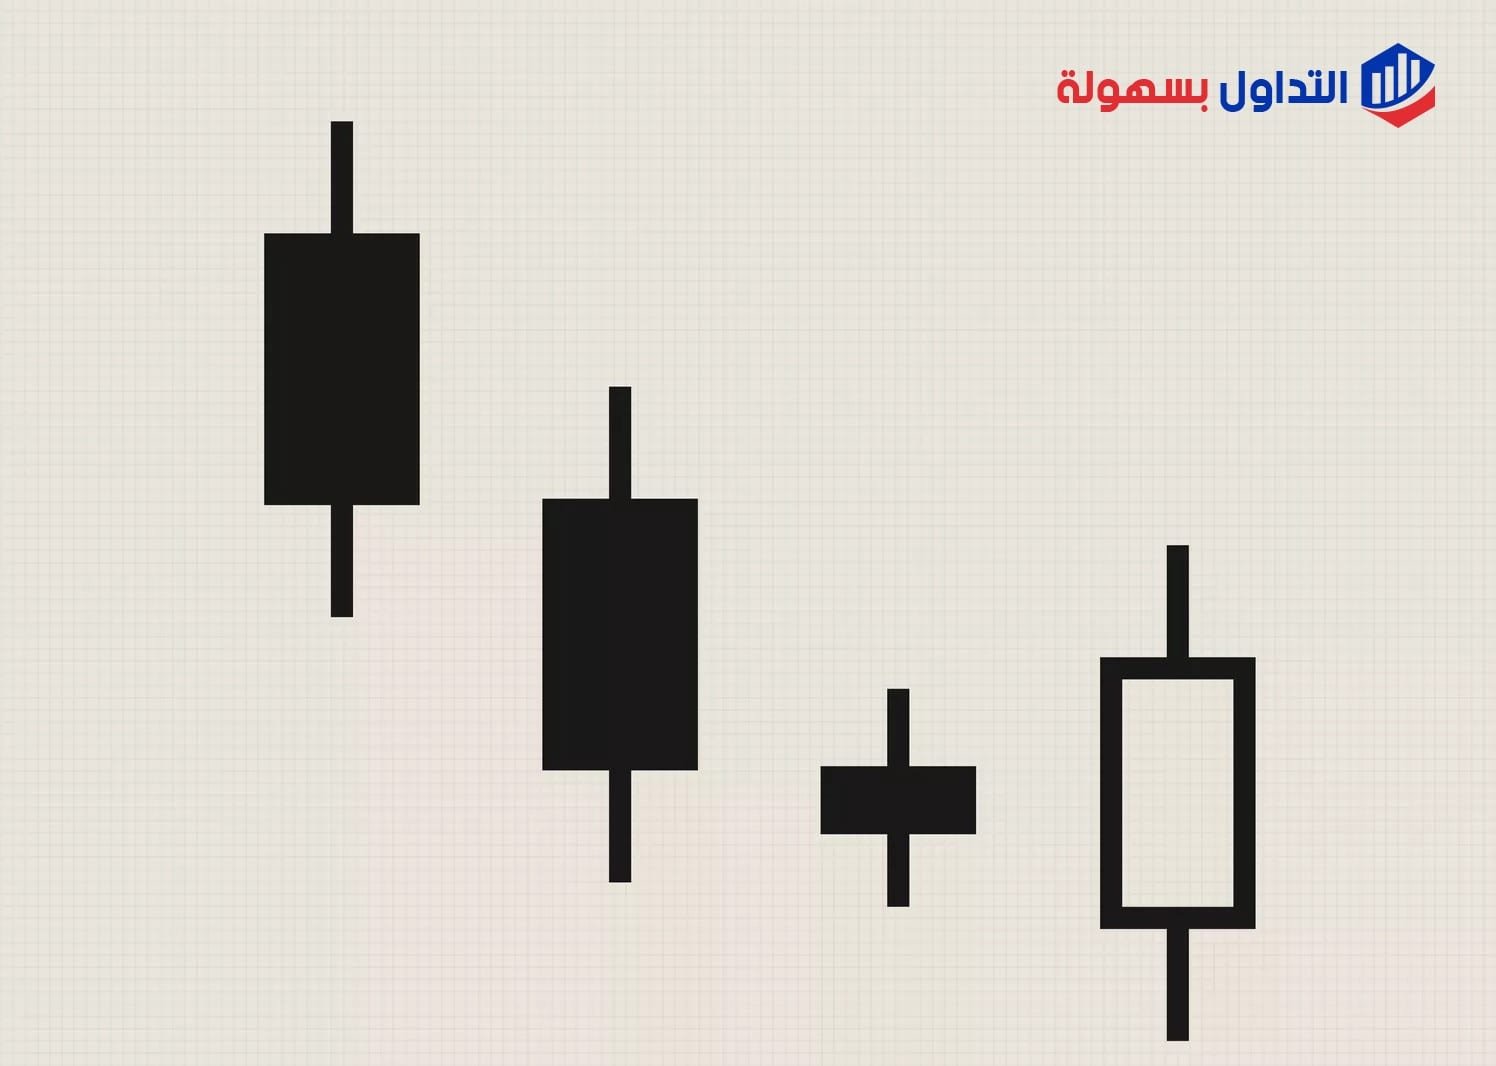
Bearish Evening Star in Japanese Candlesticks
The evening star ranks first in strength among these patterns. It’s identified by the last candle in the pattern opening below the previous day’s small real body, and that small real body can be red or green. The last candle also closes deep into the real body of the candle from two days earlier, so the pattern shows buyers stalling and then sellers taking control.
Read also: The Evening Star pattern
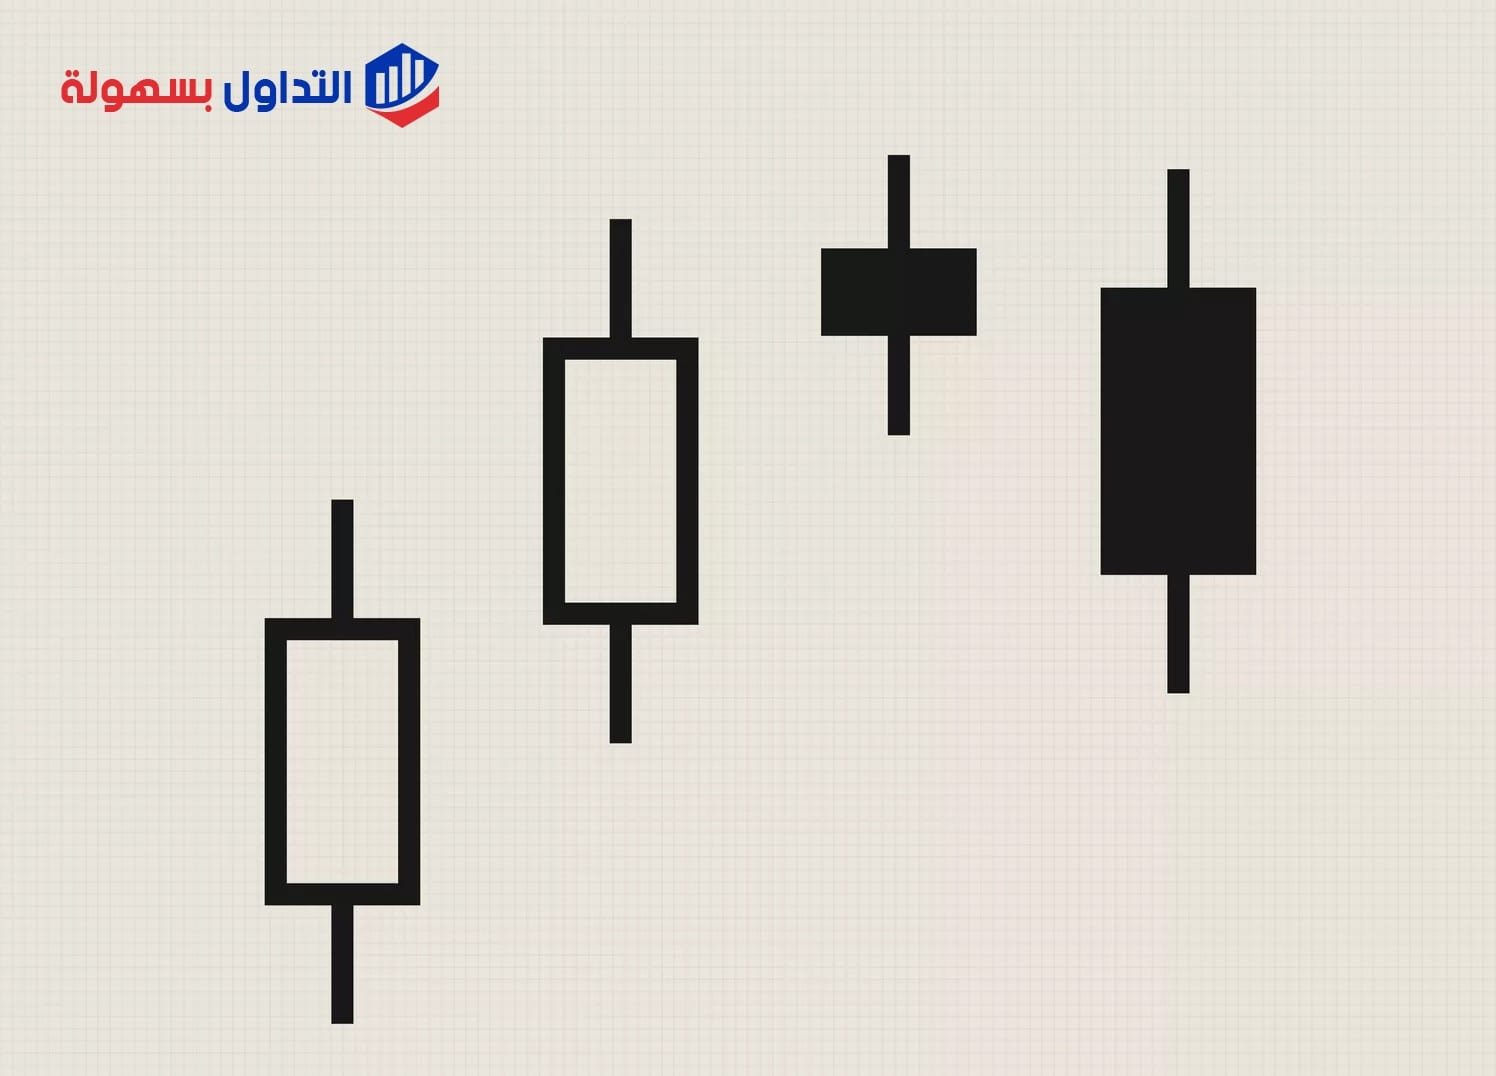
Bearish Engulfing Model in Japanese Candlesticks
The bearish engulfing model forms when a small red real body sits entirely inside the previous day’s real body. This isn’t a strong pattern to trade on its own, but it’s one to watch, since it gives an early warning that a reversal may be near. The pattern shows hesitation from buyers — the price can keep rising after it appears, so the trend may still be bullish, but the strong bearish candle that follows this pattern points to further downside.
Read also: What is the Shooting Star pattern?
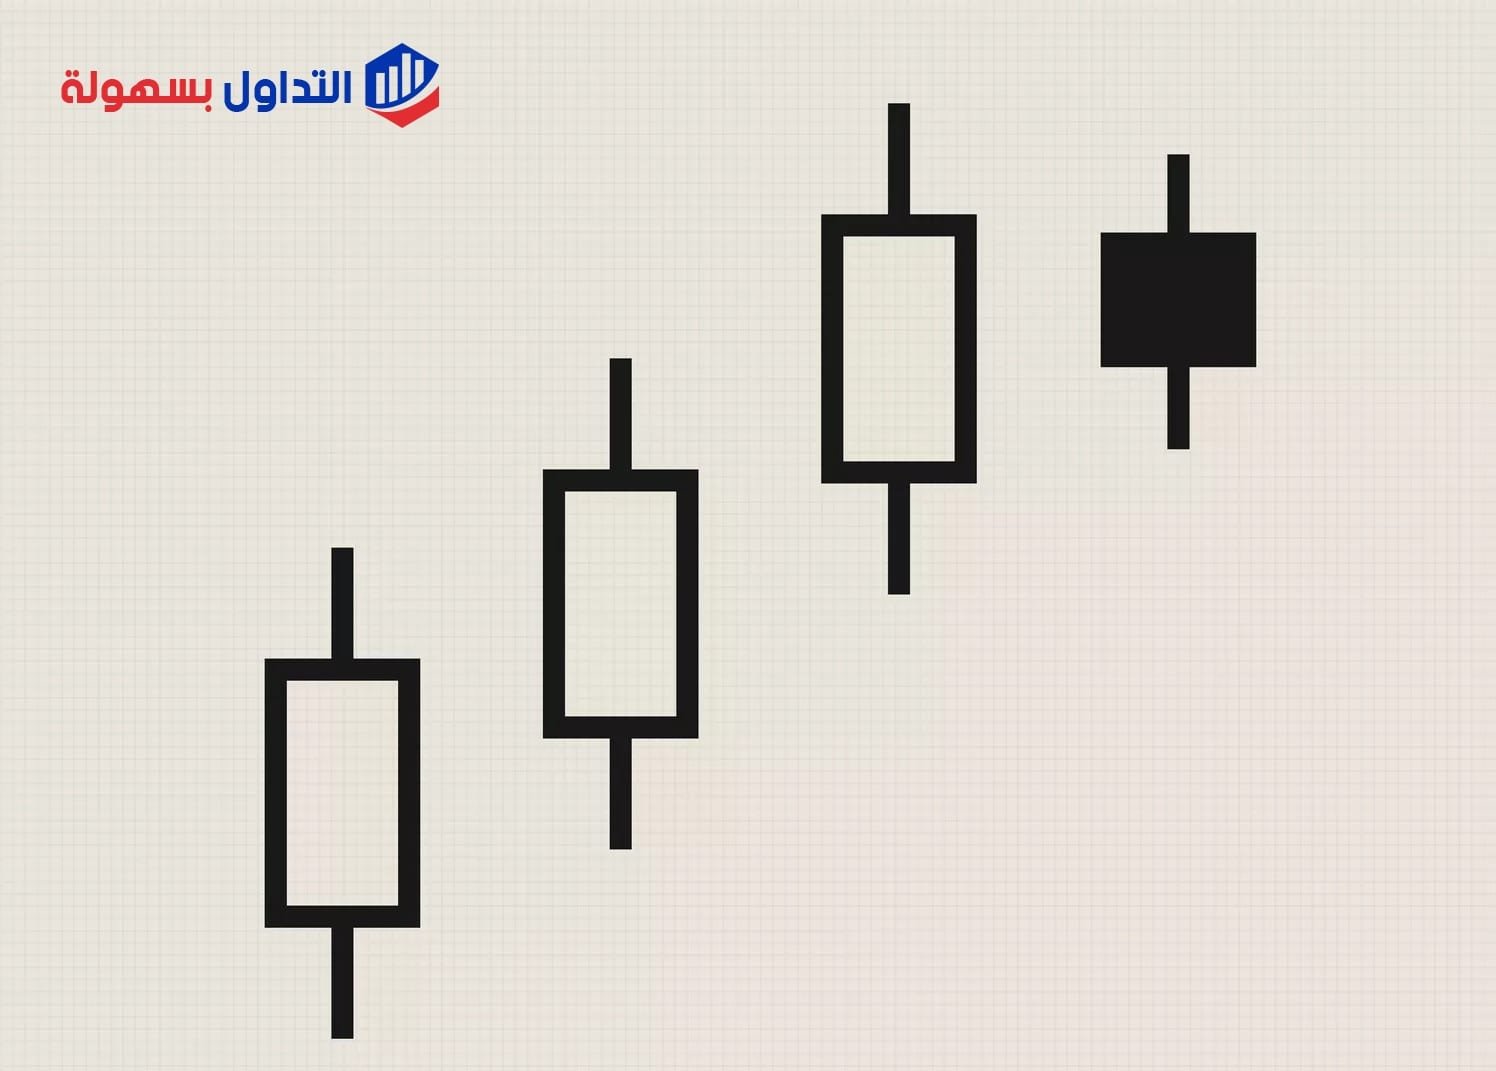
Bullish Engulfing Model in Japanese Candlesticks

The bullish engulfing model is the exact mirror image of the bearish engulfing model. When the trend is bearish and a small green real body appears inside the previous day’s large red real body, this pattern tells you the trend will pause temporarily. If a strong bullish candle follows it, there may be a reversal toward an uptrend.
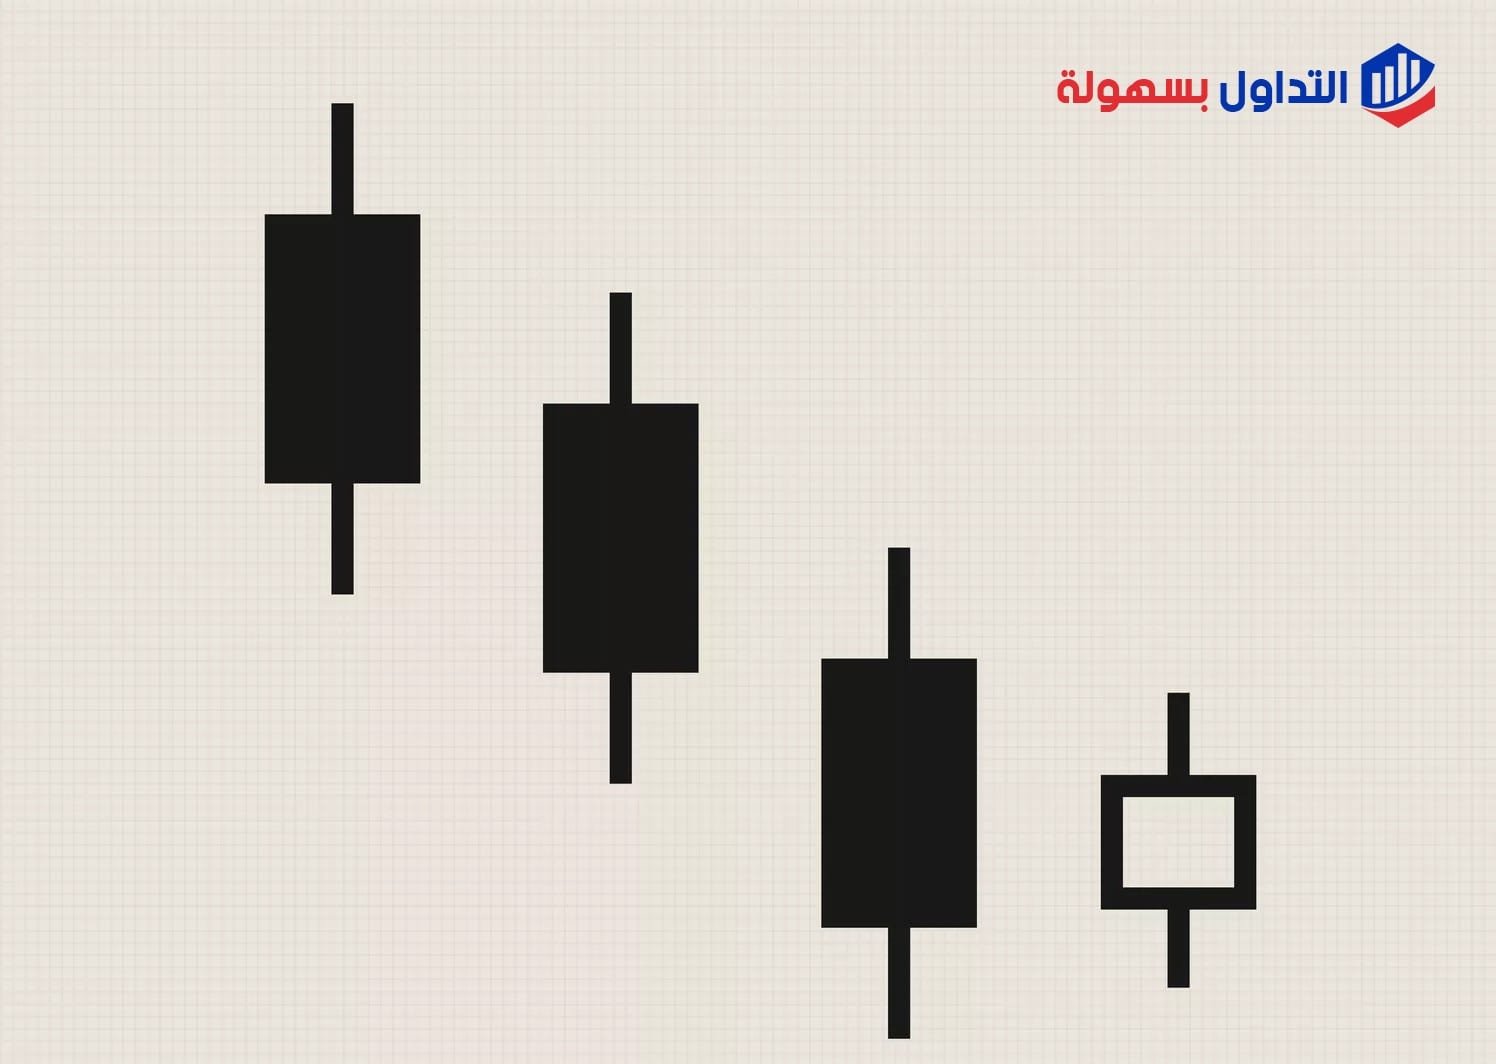
Bearish Star Model in Japanese Candlesticks
The bearish star model occurs at the end of an uptrend, where a bullish candle is followed by a doji candle — a candle whose open and close prices are nearly equal. The doji sits inside the real body of the previous candle.
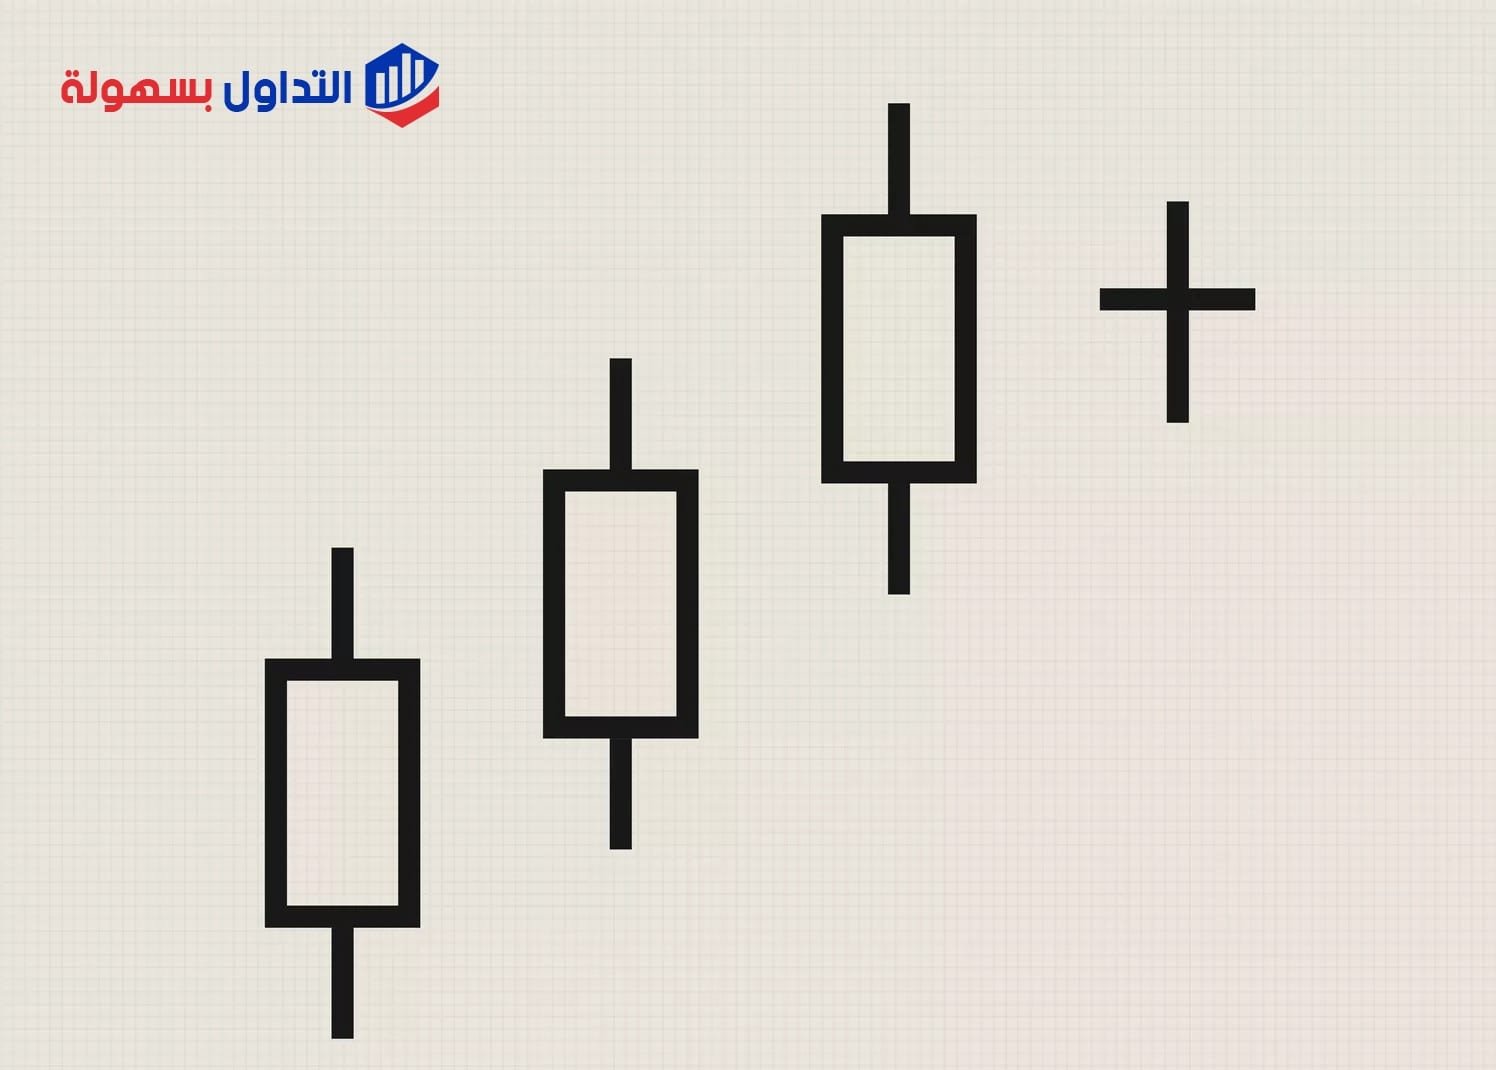
Bullish Star Model in Japanese Candlesticks
The bullish star model occurs at the end of a downtrend, followed by a doji candle to the downside. The doji sits inside the real body of the previous candle, and the implications are the same as for the bullish star.
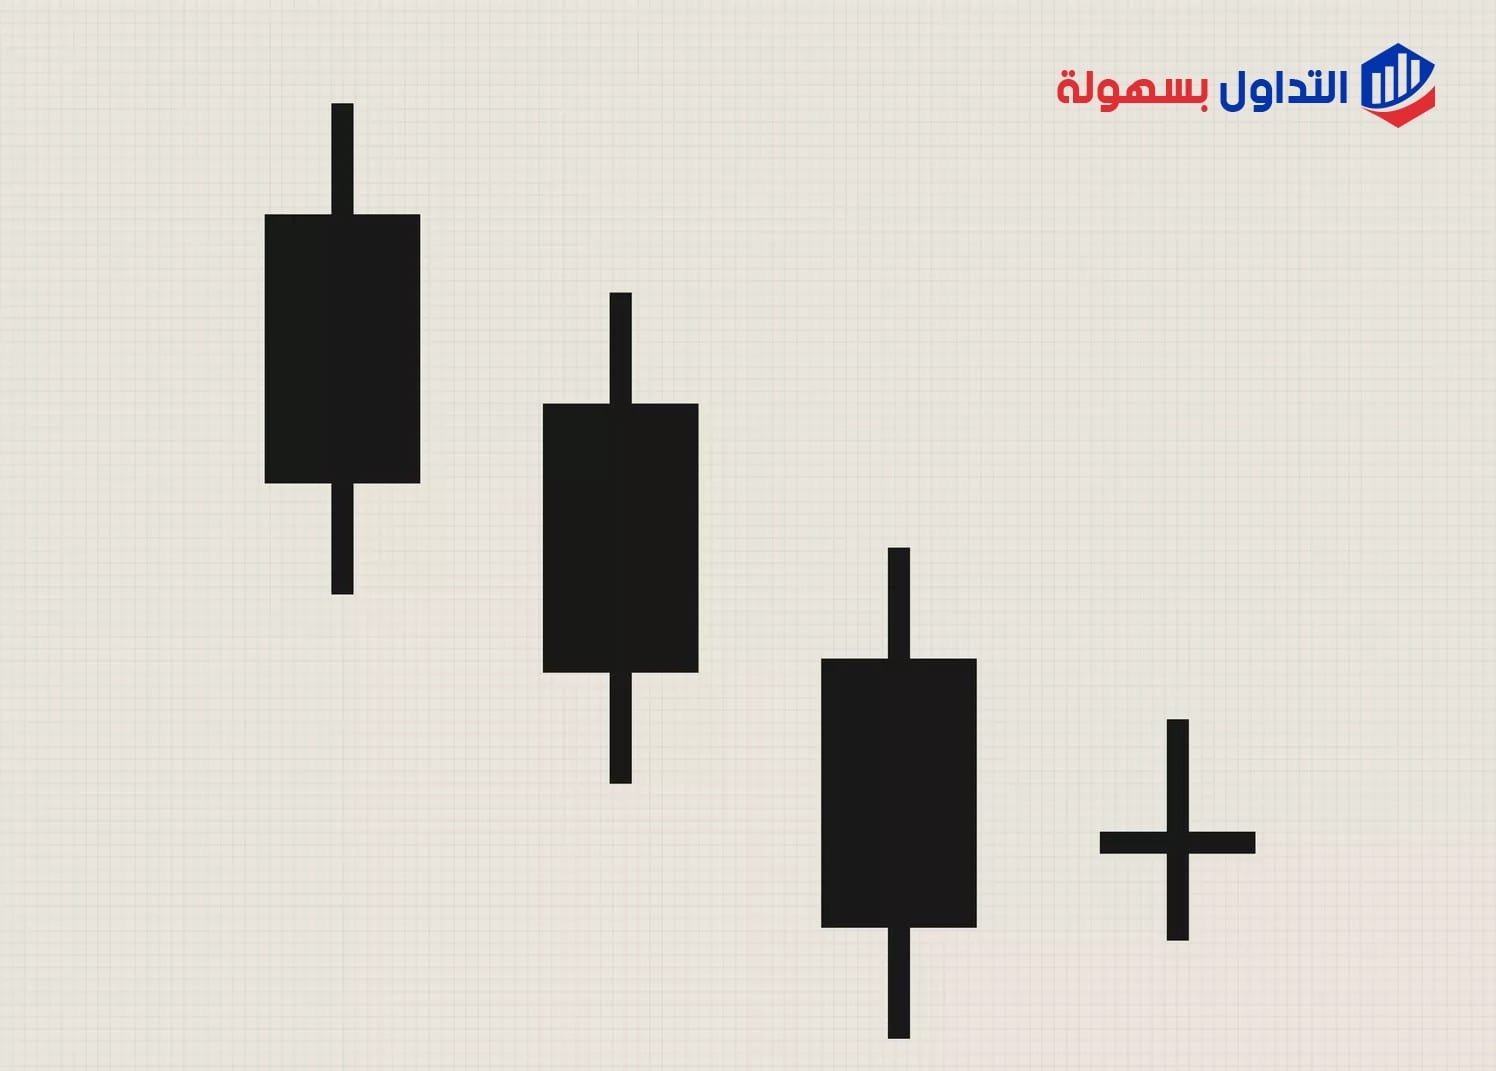
Three Rising Candles Model in Japanese Candlesticks
This pattern starts with what’s called a long bullish candle. Then, in the second, third, and fourth trading sessions, small bearish real bodies form, but they stay within the price range of the long bullish candle. The pattern completes when the fifth and final candle is another long-bodied bullish candle.
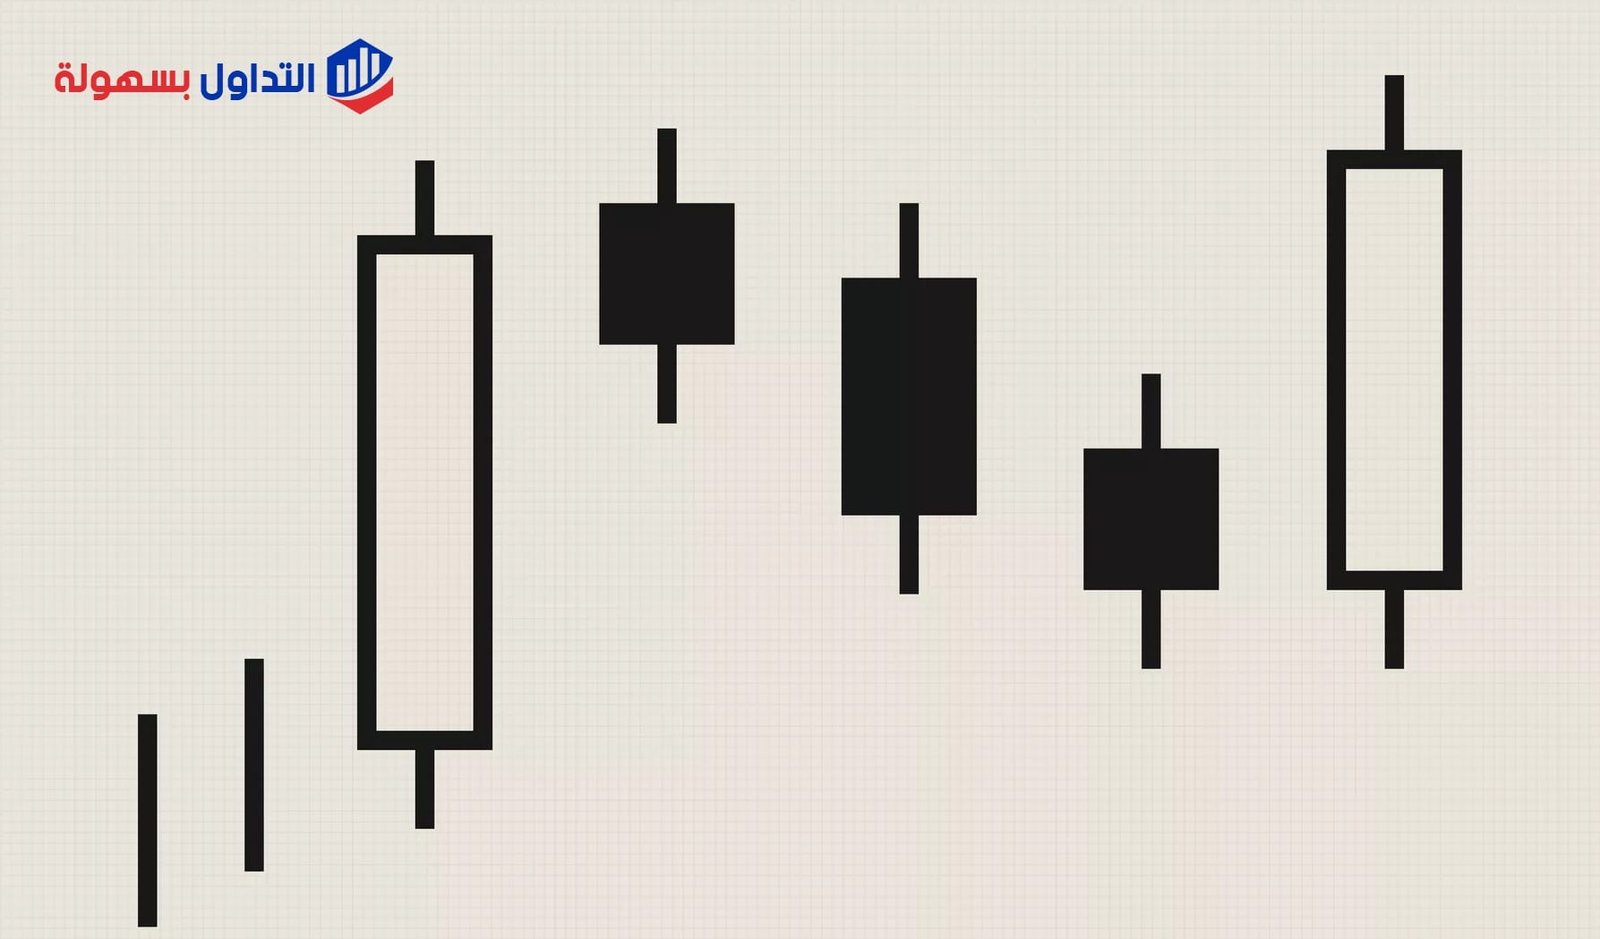
Although the model shows the price falling for three consecutive candles, no new low is seen, and bullish traders get ready for the next move higher.
Read also: What are Heikin Ashi candles?
Three Falling Candles Model in Japanese Candlesticks
This model starts with a strong bearish candle, followed by three candles with small bullish real bodies, but they stay within the range of the first large bearish candle. The pattern completes when the fifth candle makes another large bearish move. The pattern shows that sellers have taken back control and the price may head lower.
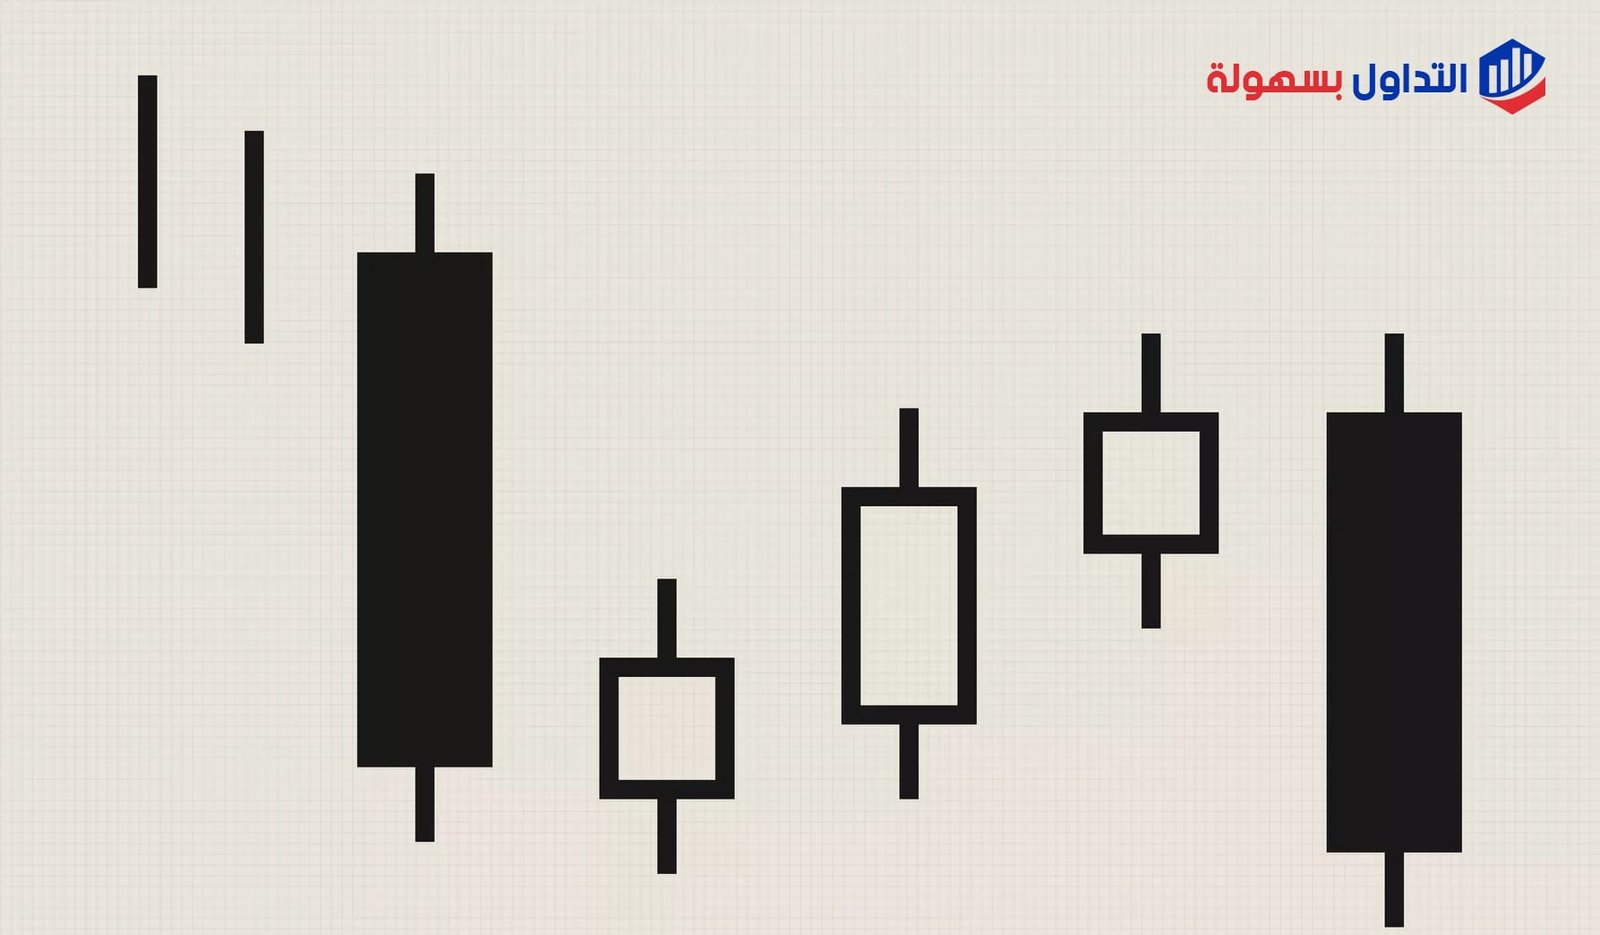
Traders use Japanese candlestick charts to identify potential price movement based on past patterns, and candles are useful in trading because they show four price points (open, close, high, low) over the time period a trader sets.
Finally
Just as Japanese rice traders discovered candles centuries ago, investor emotion around trading an asset has a major effect on that asset’s price movement. Japanese candlesticks help traders gauge the emotions surrounding a stock or other asset, which helps them make better predictions about the direction that stock or asset may move.
FAQ About Japanese Candlestick Patterns
What is technical analysis of stocks?
It’s forecasting a stock’s future price and direction based on studying its past price direction and trading volume. Producing an accurate technical analysis requires specialized software to chart the price’s path.
How many types of Japanese candlesticks are there?
The number of Japanese candlestick types is close to 100, though they aren’t all equally well-known or widely used. About 12 types of Japanese candlesticks are the most commonly used.
How do you identify support and resistance points?
The support point is the lowest point the price reaches, while the resistance point is the highest point the price reaches.
Test this indicator without risking capital
Reading about an indicator is not the same as watching it behave on a live chart. A demo account lets you apply the settings above to real market data and see how the signals form before any money is involved.
Advertising disclosure: partner link. Easy Trade may receive compensation. Educational content, not financial advice. CFDs carry a high risk of losing your capital.
Disclaimer: This article is for educational purposes only and does not constitute investment advice. Trading CFDs and other leveraged products carries a high level of risk and may not be suitable for every investor; you could lose more than your initial deposit. This page may contain affiliate links, and EasyTradeWeb may earn a commission from partner links at no extra cost to you.