
Piercing Pattern Explained

The Piercing Pattern is a two-candle Japanese candlestick price pattern that signals a possible short-term reversal from a downtrend to an uptrend. The pattern involves the first candle opening near the high and closing near the low, with an average or larger-than-average trading range. It also involves a gap down after the first candle, where the second candle starts trading, opens near the low, and closes near the high. The close must also be a candle that covers at least half the bullish length of the previous bearish candle’s body, and it should appear at the end of a strong downtrend. It helps to understand Sushi Roll Pattern.
Read more: the most well-known Japanese candlestick patterns.
Key Points of the Piercing Pattern
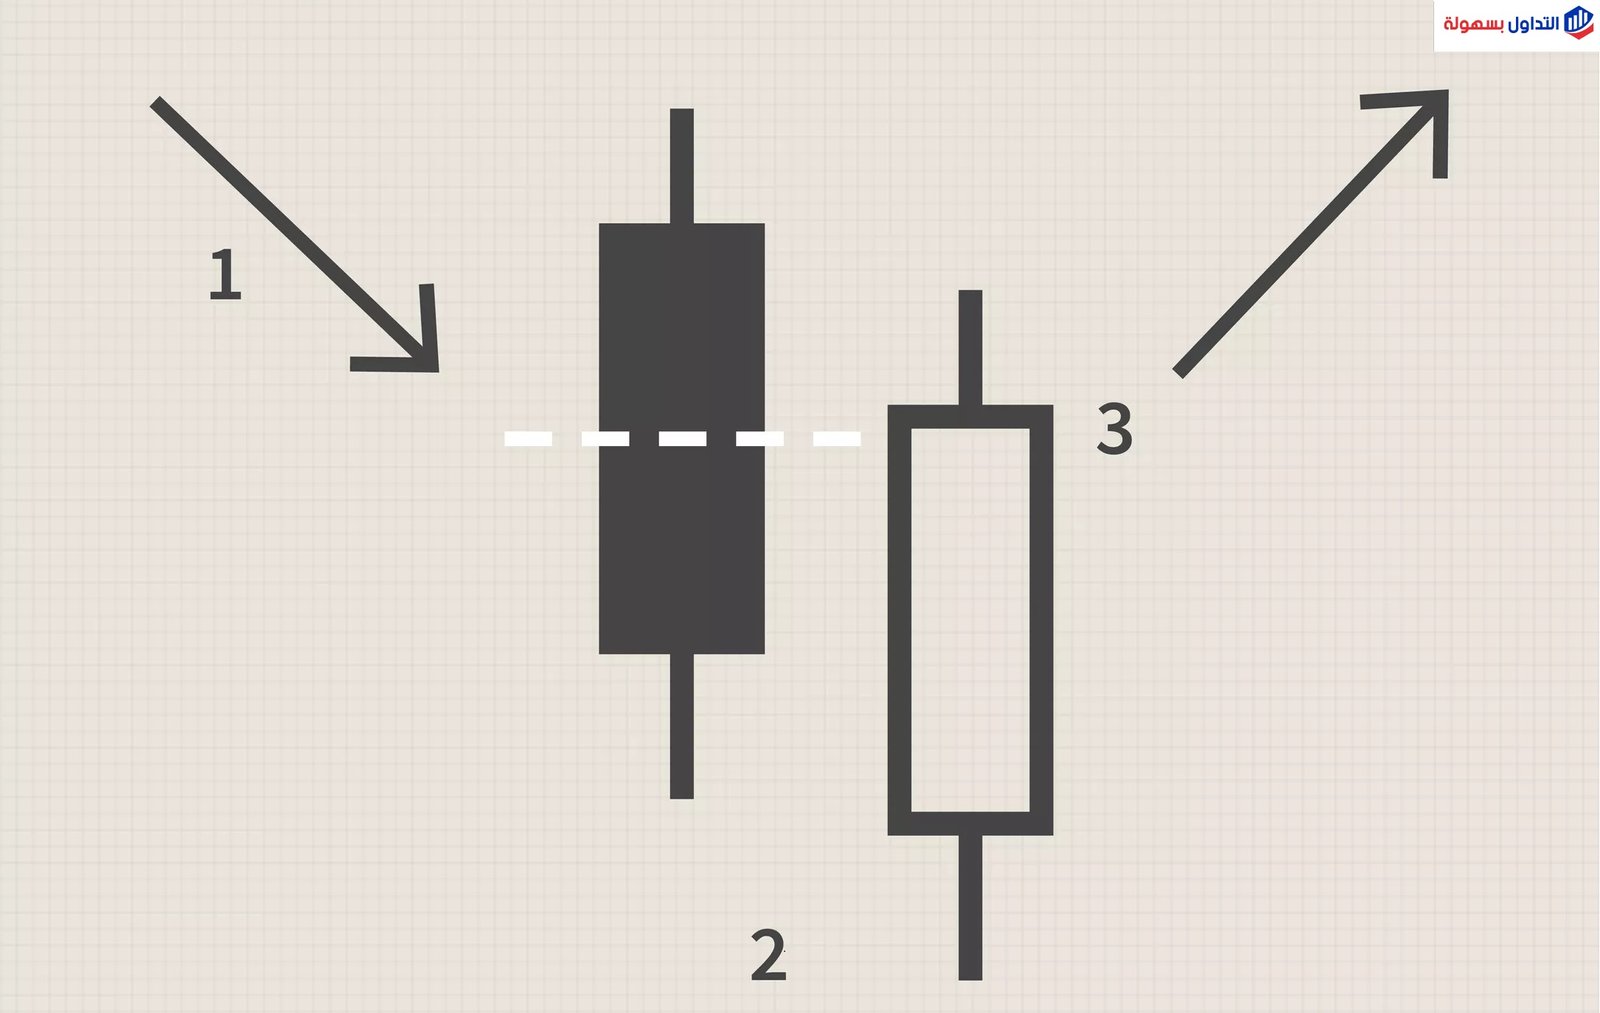
- As mentioned, this pattern is a two-candle formation that signals a possible reversal from a downtrend to an uptrend, and this candle pattern typically projects around five subsequent candles of upward movement.
- The three characteristics of this pattern are a clear downtrend before the pattern, a gap after the first candle, and a strong reversal shown by the second candle.
How Does the Piercing Pattern Work?
This pattern involves just two candles: the first is clearly dominated by sellers, while the second shows a response from buyers taking control. This is likely a sign that the supply of the asset that market participants wanted to sell has been largely exhausted, and the price has fallen to a level where buying demand has clearly increased. This price action tends to be a fairly reliable signal of a possible short-term move higher.
Shape of the Piercing Pattern
This pattern is one of the important Japanese candlestick patterns that technical analysts typically watch for on a price chart. It consists of the two consecutive candles described above, and it also has the three additional key characteristics mentioned earlier.
This pattern is preceded by a downtrend in price, even if it is just a short one. But if the candles appear after an uptrend in price, this is never a meaningful reversal signal.
Prices then drop in a gap to start the second candle. This pattern is found mostly in stocks, because they can form gaps from time to time, unlike currencies or other assets that trade around the clock. Even so, this pattern can occur in any asset class on the weekly chart.
The second candle must also close above the midpoint of the first candle. This shows that buyers overwhelmed sellers in that session, and it confirms the pattern.
Finally, the first candle is usually bearish with a relatively large body, showing the decline, while the second is bullish, showing that price closes higher than it opened. At that point a trader watches for a bullish reversal — any bearish candle followed by a bullish one can be worth noting, but the Piercing Pattern stands out because the reversal is likely to be unexpected for most market participants. Here is an example of the pattern:

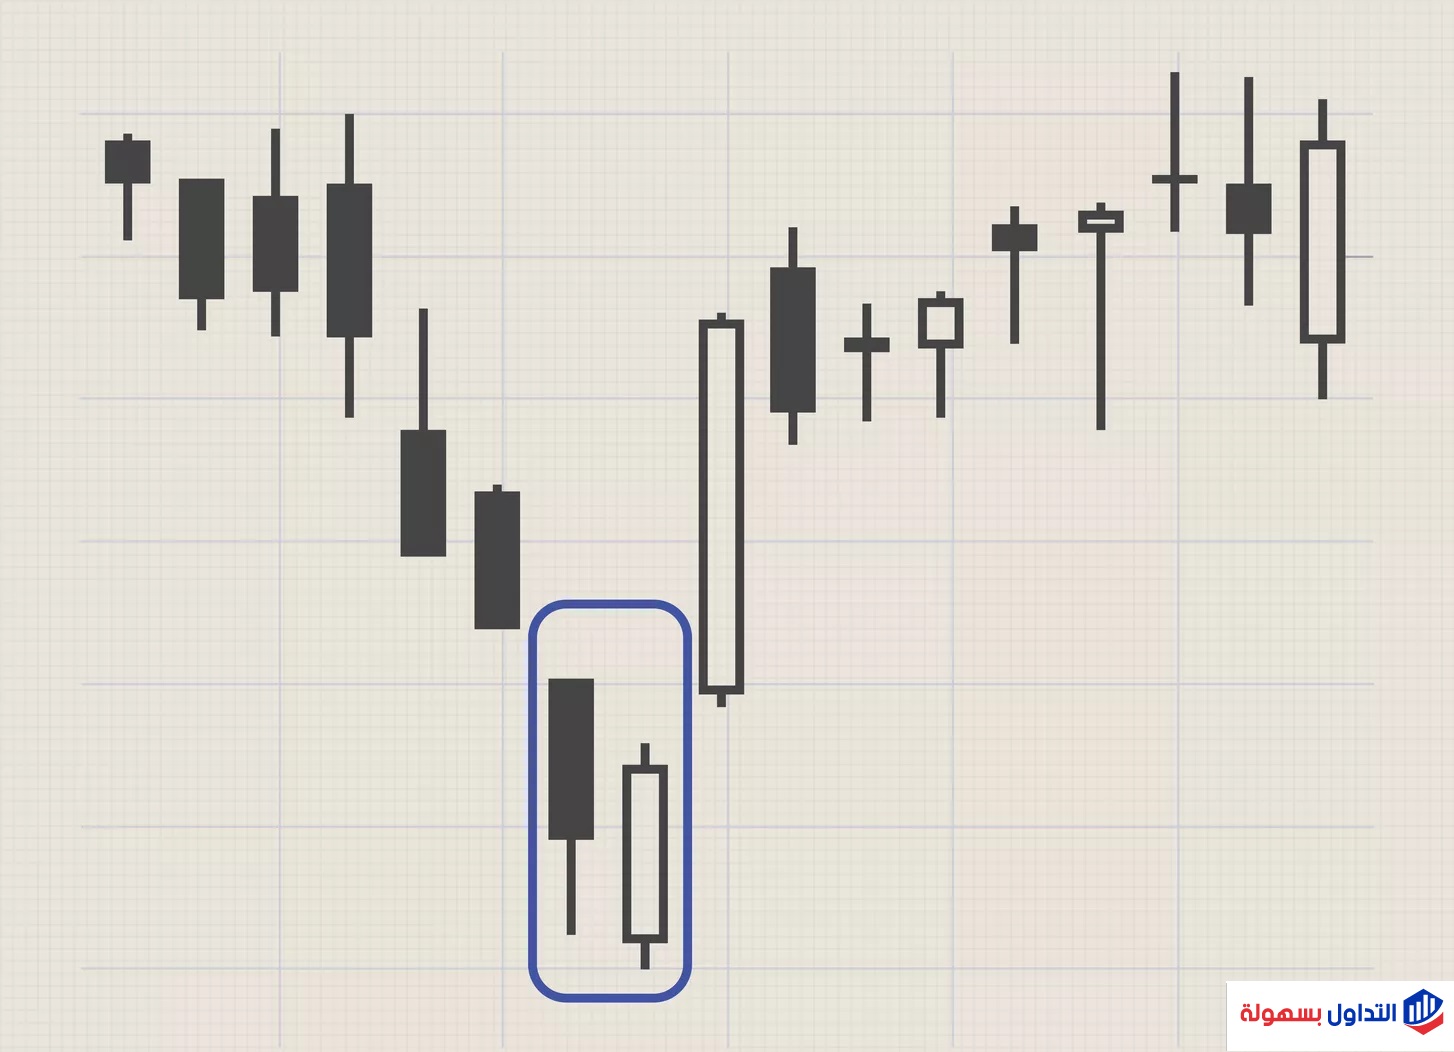
In technical analysis, the Piercing Pattern is known as a possible signal of a bullish reversal. Its most confirmed form is fairly rare, but it tends to perform better the longer the downtrend before it. When other technical signals such as the RSI, Stochastic, or MACD show bullish divergence at the same time the pattern appears, that strengthens the odds that this two-candle pattern is useful on the daily timeframe.
The bounce of the second, bullish candle from a downward gap to a closing level above the midpoint is expected to be a sign that a strong support level has been reached. This can happen because market makers set the opening price below the prior period’s closing price. When this happens once the market opens, buyers may step in forcefully and reverse the price move right from the start of the trading day.
The pattern can be confirmed further if it occurs at a support trendline of a price channel where buying has previously played a role. The pattern is usually just a possible reversal signal, so traders who follow it may want to watch for a breakaway gap before making decisions.
A breakaway gap is a pattern that occurs at the first stage of a reversal. It is identified by two consecutive bearish candles, then a bullish candle that shows a large gap below the closing price of the candle before it, moving up to the opening price of the first candle.
In the bullish reversal produced by this pattern, traders generally have two common choices: they can buy to benefit from the uptrend, or they may choose a speculative buy order below the current market price.
Finally, the Piercing Pattern is regarded as a bullish reversal candlestick pattern that appears at the bottom of a downtrend and often leads to a change in direction as buyers enter the market and push prices higher. The Piercing Pattern consists of two candles: the second, bullish candle opens lower than the prior bearish candle, after which buyers push the price to close above 50% of the bearish candle’s body.
Test this indicator without risking capital
Reading about an indicator is not the same as watching it behave on a live chart. A demo account lets you apply the settings above to real market data and see how the signals form before any money is involved.
Advertising disclosure: partner link. Easy Trade may receive compensation. Educational content, not financial advice. CFDs carry a high risk of losing your capital.
Read more:
- Japanese Candlestick Patterns: the 14 Most Common Reversal Patterns
- The Best 9 Patterns to Master Japanese Candlesticks in Trading
- High Wave Candle Pattern
Disclaimer: This article is for educational purposes only and is not investment advice. The Piercing Pattern is a technical signal, not a guarantee — a candlestick reversal setup can fail and price can continue in its original direction. Trading CFDs and other leveraged instruments carries a high level of risk and may not be suitable for every investor; you can lose more than your initial deposit. This page may contain affiliate links, and we may earn a commission if you open an account through one of them, at no extra cost to you.